29
/
en
AIzaSyAYiBZKx7MnpbEhh9jyipgxe19OcubqV5w
April 1, 2024
35138
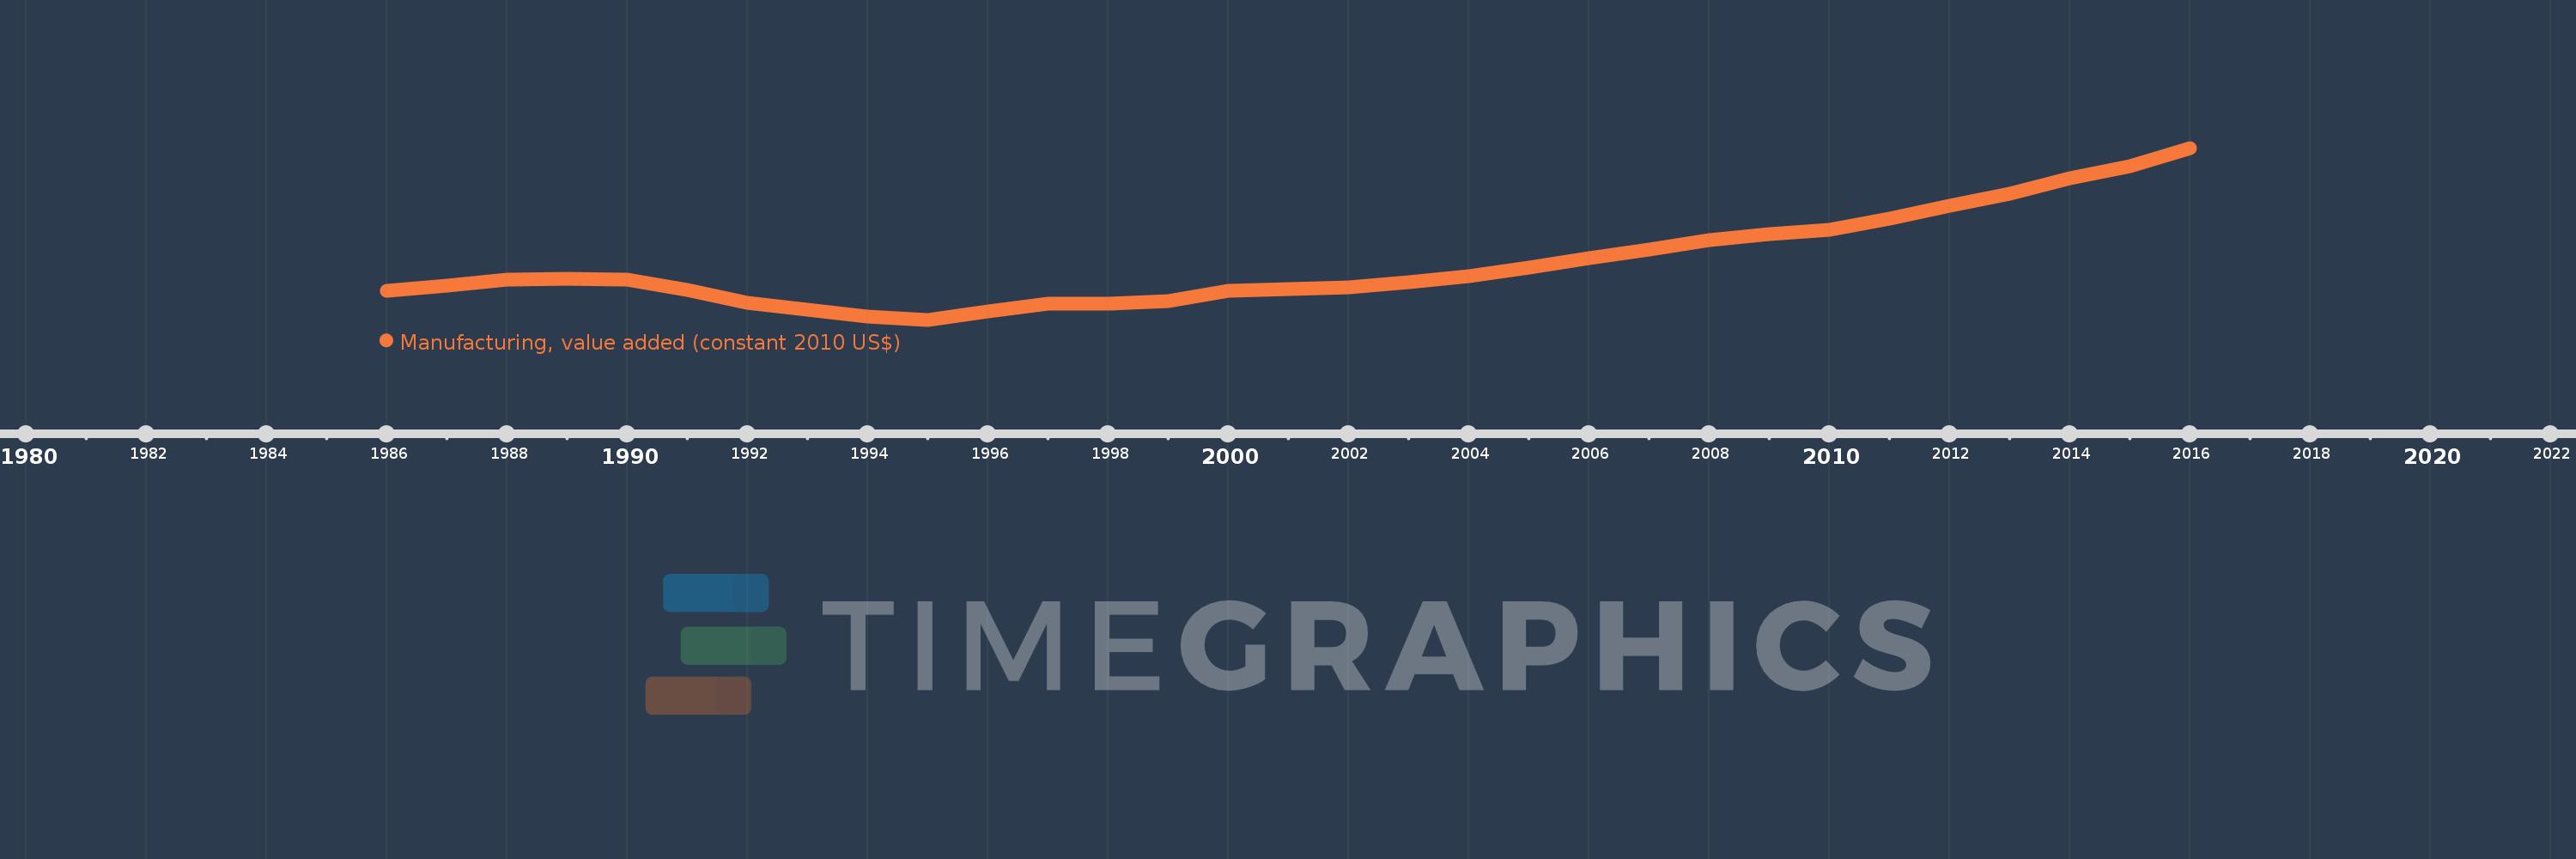
Heavily indebted poor countries (HIPC)
HPC
false
2
1
Manufacturing, value added (constant 2010 US$)
2016,2015,2014,2013,2012,2011,2010,2009,2008,2007,2006,2005,2004,2003,2002,2001,2000,1999,1998,1997,1996,1995,1994,1993,1992,1991,1990,1989,1988,1987,1986
This statistics in other country:
AfghanistanAlbaniaAndorraAntigua and BarbudaArab WorldArgentinaArmeniaArubaAustraliaAustriaAzerbaijanBahamas, TheBahrainBangladeshBarbadosBelarusBelgiumBelizeBeninBermudaBhutanBoliviaBosnia and HerzegovinaBotswanaBrazilBrunei DarussalamBurkina FasoBurundiCambodiaCameroonCanadaCaribbean small statesCentral African RepublicCentral Europe and the BalticsChadChileChinaColombiaComorosCongo, Dem. Rep.Congo, Rep.Costa RicaCote d'IvoireCroatiaCubaCyprusCzech RepublicDenmarkDominicaDominican RepublicEarly-demographic dividendEast Asia & PacificEast Asia & Pacific (excluding high income)East Asia & Pacific (IDA & IBRD countries)EcuadorEgypt, Arab Rep.El SalvadorEquatorial GuineaEstoniaEthiopiaEuro areaEurope & Central AsiaEurope & Central Asia (excluding high income)Europe & Central Asia (IDA & IBRD countries)European UnionFaroe IslandsFijiFinlandFragile and conflict affected situationsFranceGabonGambia, TheGeorgiaGermanyGhanaGreeceGrenadaGuatemalaGuineaGuyanaHeavily indebted poor countries (HIPC)High incomeHondurasHong Kong SAR, ChinaHungaryIBRD onlyIcelandIDA & IBRD totalIDA blendIDA onlyIDA totalIndiaIndonesiaIran, Islamic Rep.IraqIrelandItalyJamaicaJapanJordanKazakhstanKenyaKiribatiKorea, Rep.KosovoKuwaitKyrgyz RepublicLao PDRLate-demographic dividendLatin America & Caribbean Latin America & Caribbean (excluding high income)Latin America & the Caribbean (IDA & IBRD countries)LatviaLeast developed countries: UN classificationLebanonLesothoLiberiaLithuaniaLow & middle incomeLow incomeLower middle incomeLuxembourgMacao SAR, ChinaMacedonia, FYRMalawiMalaysiaMaldivesMaltaMarshall IslandsMauritaniaMauritiusMexicoMicronesia, Fed. Sts.Middle East & North AfricaMiddle East & North Africa (excluding high income)Middle East & North Africa (IDA & IBRD countries)Middle incomeMoldovaMongoliaMontenegroMoroccoMozambiqueMyanmarNamibiaNepalNetherlandsNew ZealandNicaraguaNigerNigeriaNorth AmericaNorwayOECD membersOmanOther small statesPacific island small statesPakistanPalauPanamaParaguayPeruPhilippinesPolandPortugalPost-demographic dividendPre-demographic dividendPuerto RicoQatarRomaniaRussian FederationRwandaSamoaSao Tome and PrincipeSaudi ArabiaSenegalSerbiaSeychellesSierra LeoneSingaporeSlovak RepublicSloveniaSmall statesSouth AfricaSouth AsiaSouth Asia (IDA & IBRD)SpainSri LankaSt. Kitts and NevisSt. LuciaSt. Vincent and the GrenadinesSub-Saharan Africa Sub-Saharan Africa (excluding high income)Sub-Saharan Africa (IDA & IBRD countries)SudanSurinameSwazilandSwedenSwitzerlandTajikistanTanzaniaThailandTimor-LesteTogoTongaTrinidad and TobagoTunisiaTurkeyTuvaluUgandaUkraineUnited Arab EmiratesUnited KingdomUnited StatesUpper middle incomeUruguayUzbekistanVanuatuVenezuela, RBVietnamWest Bank and GazaWorldYemen, Rep.ZambiaZimbabwe Timeline:
This timeline shows a graph from 1986 to 2016 of Heavily indebted poor countries (HIPC). No data until 1985. Number of actual observations by date: 31.
Source name:
World Development Indicators
Source organization:
World Bank national accounts data, and OECD National Accounts data files.
Categories, topics:
Economy & Growth
Last updated:
apr 23, 2017
Indicators value changes by year
Minimum:
22.535 bln
jan 1, 1995
Maximum:
53.667 bln
jan 1, 2016
At the date of observation
Value
Absolute change
Change from previous value
jan 1, 1986
27.852 bln
+27.852 bln
0.0%
jan 1, 1987
28.711 bln
+858.308 mln
3.08%
jan 1, 1988
29.802 bln
+1.091 bln
3.8%
jan 1, 1989
30.019 bln
+216.969 mln
0.73%
jan 1, 1990
29.774 bln
-244.58 mln
-0.81%
jan 1, 1991
27.915 bln
-1.86 bln
-6.25%
jan 1, 1992
25.648 bln
-2.267 bln
-8.12%
jan 1, 1993
24.422 bln
-1.225 bln
-4.78%
jan 1, 1994
23.124 bln
-1.298 bln
-5.31%
jan 1, 1995
22.535 bln
-589.116 mln
-2.55%
jan 1, 1996
24.038 bln
+1.502 bln
6.67%
jan 1, 1997
25.411 bln
+1.374 bln
5.71%
jan 1, 1998
25.384 bln
-27.591 mln
-0.11%
jan 1, 1999
25.862 bln
+478.948 mln
1.89%
jan 1, 2000
27.767 bln
+1.904 bln
7.36%
jan 1, 2001
28.162 bln
+395.157 mln
1.42%
jan 1, 2002
28.474 bln
+311.869 mln
1.11%
jan 1, 2003
29.409 bln
+935.127 mln
3.28%
jan 1, 2004
30.401 bln
+992.514 mln
3.37%
jan 1, 2005
31.952 bln
+1.551 bln
5.1%
jan 1, 2006
33.76 bln
+1.808 bln
5.66%
jan 1, 2007
35.208 bln
+1.448 bln
4.29%
jan 1, 2008
36.946 bln
+1.738 bln
4.94%
jan 1, 2009
38.025 bln
+1.08 bln
2.92%
jan 1, 2010
38.797 bln
+771.932 mln
2.03%
jan 1, 2011
40.802 bln
+2.005 bln
5.17%
jan 1, 2012
43.205 bln
+2.403 bln
5.89%
jan 1, 2013
45.326 bln
+2.121 bln
4.91%
jan 1, 2014
48.129 bln
+2.803 bln
6.18%
jan 1, 2015
50.288 bln
+2.158 bln
4.48%
jan 1, 2016
53.667 bln
+3.379 bln
6.72%
Ranking of countries by current statistics by years


Comments: