29
/
en
AIzaSyAYiBZKx7MnpbEhh9jyipgxe19OcubqV5w
April 1, 2024
26706
Early-demographic dividend
EAR
false
2
1
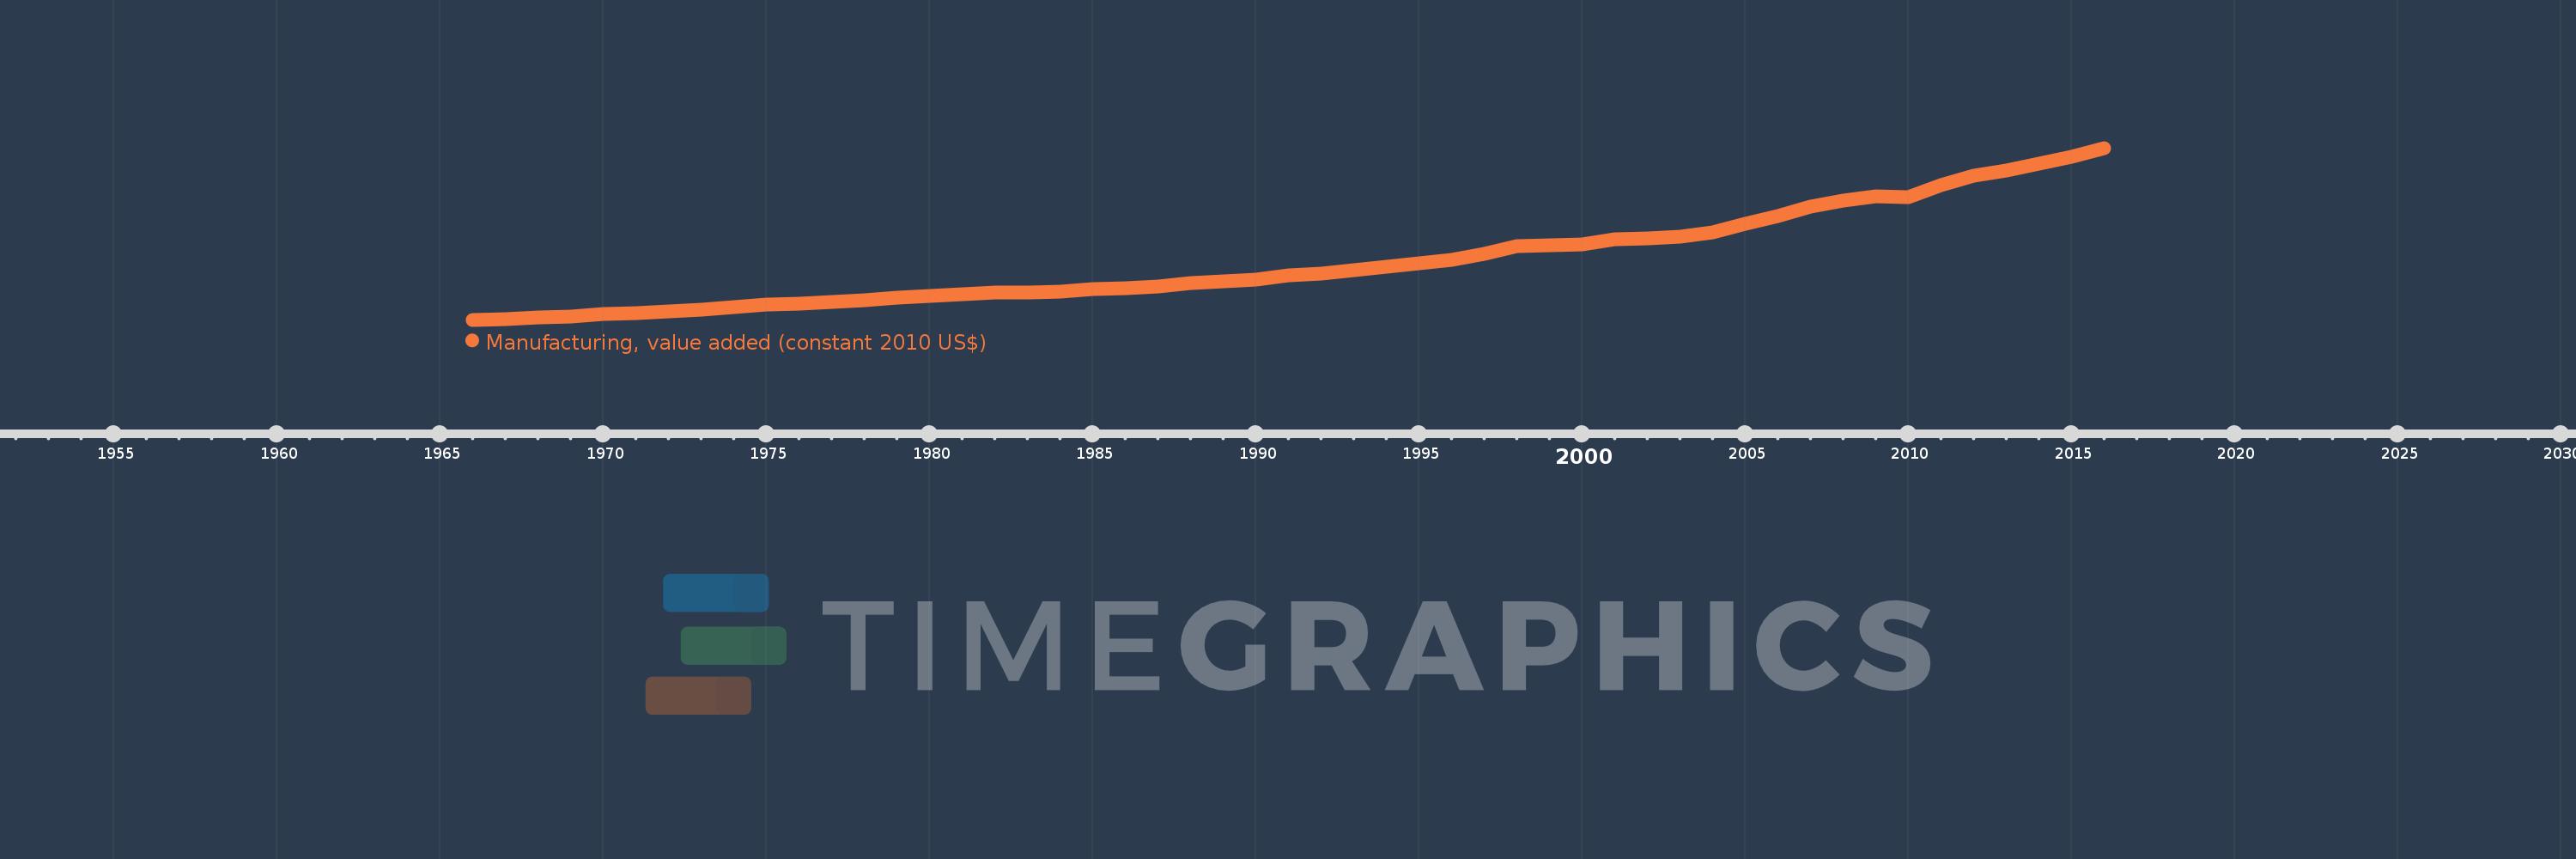
Manufacturing, value added (constant 2010 US$)
2016,2015,2014,2013,2012,2011,2010,2009,2008,2007,2006,2005,2004,2003,2002,2001,2000,1999,1998,1997,1996,1995,1994,1993,1992,1991,1990,1989,1988,1987,1986,1985,1984,1983,1982,1981,1980,1979,1978,1977,1976,1975,1974,1973,1972,1971,1970,1969,1968,1967,1966
This statistics in other country:
AfghanistanAlbaniaAndorraAntigua and BarbudaArab WorldArgentinaArmeniaArubaAustraliaAustriaAzerbaijanBahamas, TheBahrainBangladeshBarbadosBelarusBelgiumBelizeBeninBermudaBhutanBoliviaBosnia and HerzegovinaBotswanaBrazilBrunei DarussalamBurkina FasoBurundiCambodiaCameroonCanadaCaribbean small statesCentral African RepublicCentral Europe and the BalticsChadChileChinaColombiaComorosCongo, Dem. Rep.Congo, Rep.Costa RicaCote d'IvoireCroatiaCubaCyprusCzech RepublicDenmarkDominicaDominican RepublicEarly-demographic dividendEast Asia & PacificEast Asia & Pacific (excluding high income)East Asia & Pacific (IDA & IBRD countries)EcuadorEgypt, Arab Rep.El SalvadorEquatorial GuineaEstoniaEthiopiaEuro areaEurope & Central AsiaEurope & Central Asia (excluding high income)Europe & Central Asia (IDA & IBRD countries)European UnionFaroe IslandsFijiFinlandFragile and conflict affected situationsFranceGabonGambia, TheGeorgiaGermanyGhanaGreeceGrenadaGuatemalaGuineaGuyanaHeavily indebted poor countries (HIPC)High incomeHondurasHong Kong SAR, ChinaHungaryIBRD onlyIcelandIDA & IBRD totalIDA blendIDA onlyIDA totalIndiaIndonesiaIran, Islamic Rep.IraqIrelandItalyJamaicaJapanJordanKazakhstanKenyaKiribatiKorea, Rep.KosovoKuwaitKyrgyz RepublicLao PDRLate-demographic dividendLatin America & Caribbean Latin America & Caribbean (excluding high income)Latin America & the Caribbean (IDA & IBRD countries)LatviaLeast developed countries: UN classificationLebanonLesothoLiberiaLithuaniaLow & middle incomeLow incomeLower middle incomeLuxembourgMacao SAR, ChinaMacedonia, FYRMalawiMalaysiaMaldivesMaltaMarshall IslandsMauritaniaMauritiusMexicoMicronesia, Fed. Sts.Middle East & North AfricaMiddle East & North Africa (excluding high income)Middle East & North Africa (IDA & IBRD countries)Middle incomeMoldovaMongoliaMontenegroMoroccoMozambiqueMyanmarNamibiaNepalNetherlandsNew ZealandNicaraguaNigerNigeriaNorth AmericaNorwayOECD membersOmanOther small statesPacific island small statesPakistanPalauPanamaParaguayPeruPhilippinesPolandPortugalPost-demographic dividendPre-demographic dividendPuerto RicoQatarRomaniaRussian FederationRwandaSamoaSao Tome and PrincipeSaudi ArabiaSenegalSerbiaSeychellesSierra LeoneSingaporeSlovak RepublicSloveniaSmall statesSouth AfricaSouth AsiaSouth Asia (IDA & IBRD)SpainSri LankaSt. Kitts and NevisSt. LuciaSt. Vincent and the GrenadinesSub-Saharan Africa Sub-Saharan Africa (excluding high income)Sub-Saharan Africa (IDA & IBRD countries)SudanSurinameSwazilandSwedenSwitzerlandTajikistanTanzaniaThailandTimor-LesteTogoTongaTrinidad and TobagoTunisiaTurkeyTuvaluUgandaUkraineUnited Arab EmiratesUnited KingdomUnited StatesUpper middle incomeUruguayUzbekistanVanuatuVenezuela, RBVietnamWest Bank and GazaWorldYemen, Rep.ZambiaZimbabwe Timeline:
This timeline shows a graph from 1966 to 2016 of Early-demographic dividend. No data until 1965. Number of actual observations by date: 51.
Source name:
World Development Indicators
Source organization:
World Bank national accounts data, and OECD National Accounts data files.
Categories, topics:
Economy & Growth
Last updated:
apr 23, 2017
Indicators value changes by year
Minimum:
173.168 bln
jan 1, 1966
Maximum:
1.584 trl
jan 1, 2016
At the date of observation
Value
Absolute change
Change from previous value
jan 1, 1966
173.168 bln
+173.168 bln
0.0%
jan 1, 1967
180.688 bln
+7.52 bln
4.34%
jan 1, 1968
189.833 bln
+9.145 bln
5.06%
jan 1, 1969
201.925 bln
+12.092 bln
6.37%
jan 1, 1970
218.792 bln
+16.867 bln
8.35%
jan 1, 1971
230.27 bln
+11.478 bln
5.25%
jan 1, 1972
241.385 bln
+11.115 bln
4.83%
jan 1, 1973
255.306 bln
+13.921 bln
5.77%
jan 1, 1974
277.025 bln
+21.719 bln
8.51%
jan 1, 1975
295.455 bln
+18.431 bln
6.65%
jan 1, 1976
304.373 bln
+8.918 bln
3.02%
jan 1, 1977
321.172 bln
+16.799 bln
5.52%
jan 1, 1978
335.841 bln
+14.669 bln
4.57%
jan 1, 1979
351.128 bln
+15.288 bln
4.55%
jan 1, 1980
368.508 bln
+17.38 bln
4.95%
jan 1, 1981
381.553 bln
+13.045 bln
3.54%
jan 1, 1982
395.072 bln
+13.52 bln
3.54%
jan 1, 1983
395.118 bln
+45.793 mln
0.01%
jan 1, 1984
400.939 bln
+5.821 bln
1.47%
jan 1, 1985
421.683 bln
+20.743 bln
5.17%
jan 1, 1986
431.703 bln
+10.021 bln
2.38%
jan 1, 1987
447.66 bln
+15.957 bln
3.7%
jan 1, 1988
471.769 bln
+24.109 bln
5.39%
jan 1, 1989
490.17 bln
+18.401 bln
3.9%
jan 1, 1990
505.404 bln
+15.234 bln
3.11%
jan 1, 1991
534.486 bln
+29.081 bln
5.75%
jan 1, 1992
554.618 bln
+20.132 bln
3.77%
jan 1, 1993
579.388 bln
+24.77 bln
4.47%
jan 1, 1994
606.762 bln
+27.373 bln
4.72%
jan 1, 1995
634.108 bln
+27.347 bln
4.51%
jan 1, 1996
666.878 bln
+32.769 bln
5.17%
jan 1, 1997
717.383 bln
+50.505 bln
7.57%
jan 1, 1998
776.027 bln
+58.644 bln
8.17%
jan 1, 1999
781.92 bln
+5.893 bln
0.76%
jan 1, 2000
791.645 bln
+9.725 bln
1.24%
jan 1, 2001
836.251 bln
+44.606 bln
5.63%
jan 1, 2002
839.224 bln
+2.973 bln
0.36%
jan 1, 2003
855.918 bln
+16.694 bln
1.99%
jan 1, 2004
889.493 bln
+33.576 bln
3.92%
jan 1, 2005
957.62 bln
+68.126 bln
7.66%
jan 1, 2006
1.021 trl
+63.319 bln
6.61%
jan 1, 2007
1.1 trl
+78.592 bln
7.7%
jan 1, 2008
1.154 trl
+54.182 bln
4.93%
jan 1, 2009
1.184 trl
+30.481 bln
2.64%
jan 1, 2010
1.18 trl
-4.195 bln
-0.35%
jan 1, 2011
1.275 trl
+94.855 bln
8.04%
jan 1, 2012
1.355 trl
+80.472 bln
6.31%
jan 1, 2013
1.401 trl
+45.42 bln
3.35%
jan 1, 2014
1.451 trl
+50.558 bln
3.61%
jan 1, 2015
1.509 trl
+57.751 bln
3.98%
jan 1, 2016
1.584 trl
+74.686 bln
4.95%
Ranking of countries by current statistics by years


Comments: