29
/
en
AIzaSyAYiBZKx7MnpbEhh9jyipgxe19OcubqV5w
April 1, 2024
132234
Fiji
FJI
true
2
1
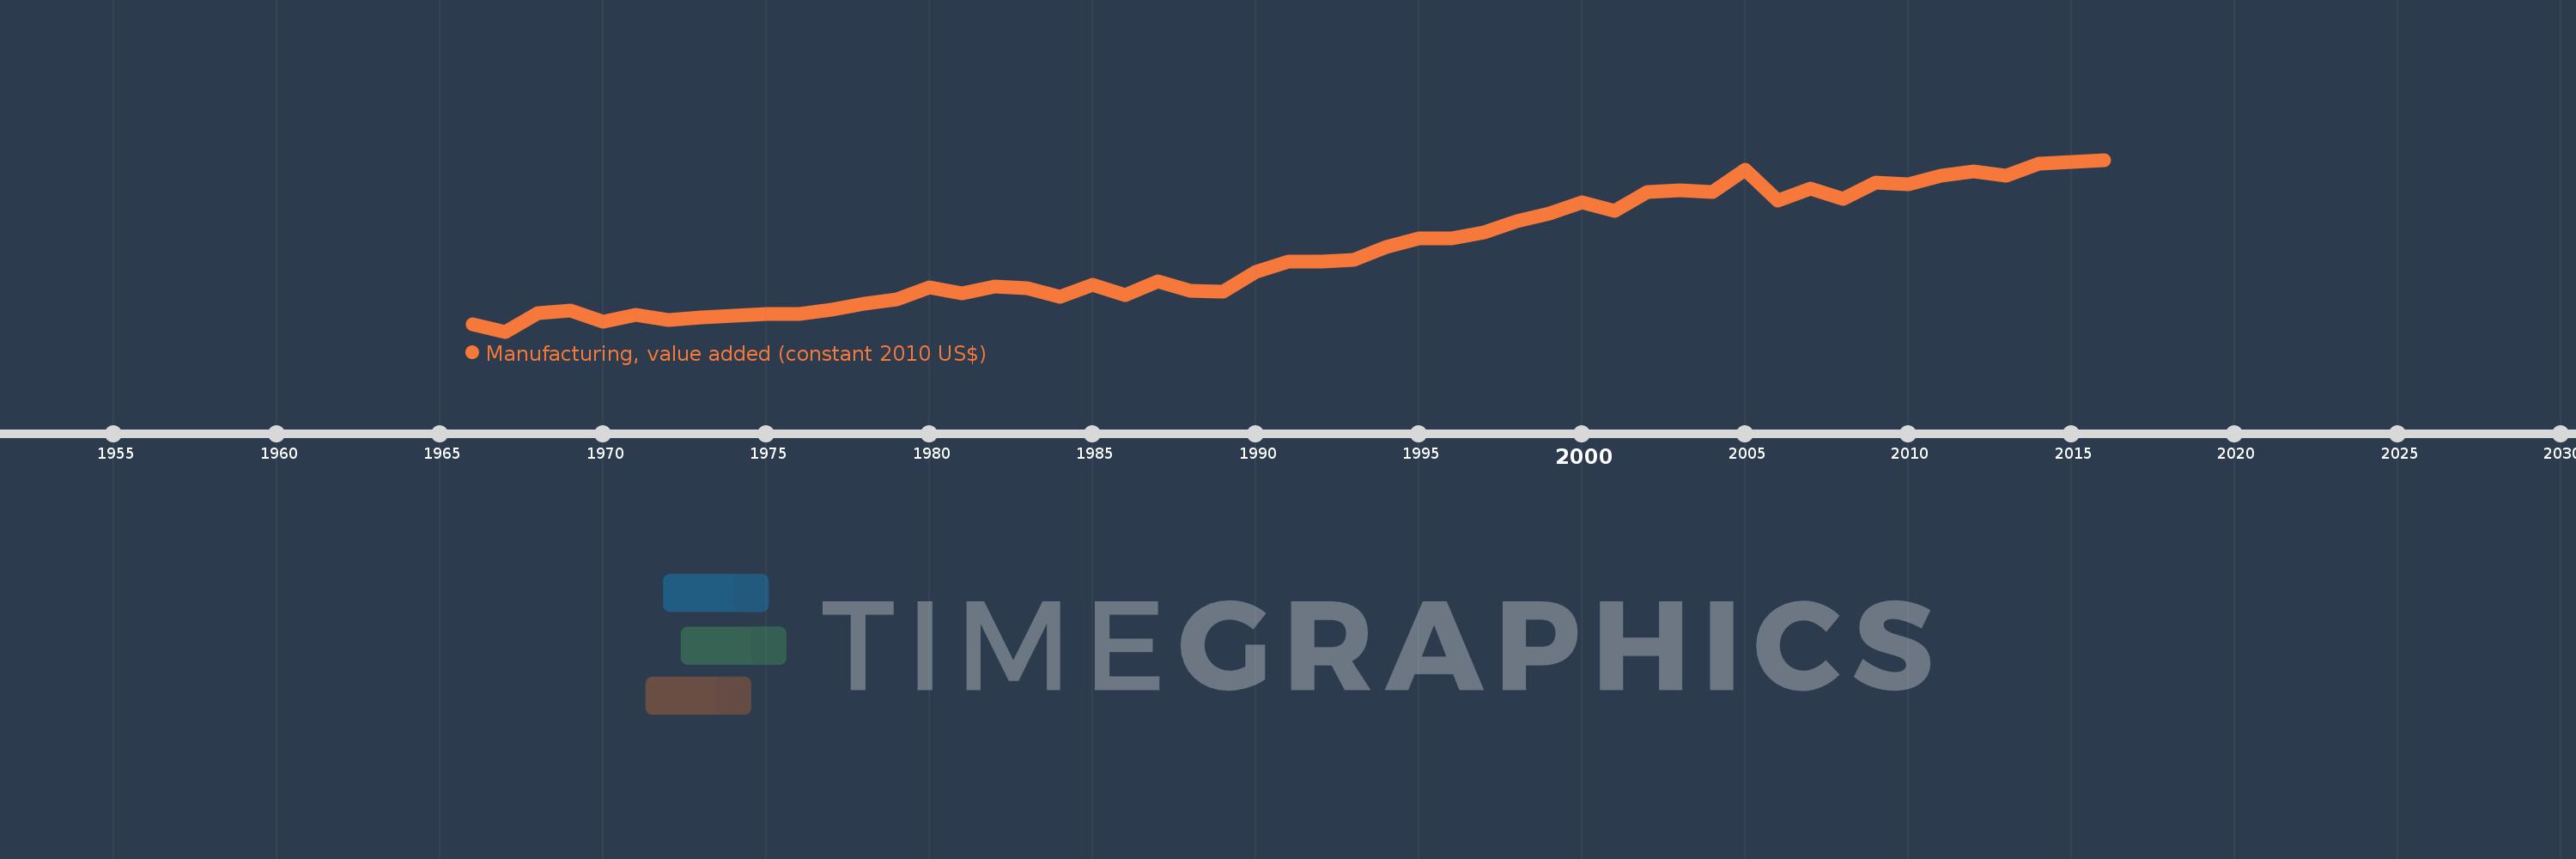
Manufacturing, value added (constant 2010 US$)
2016,2015,2014,2013,2012,2011,2010,2009,2008,2007,2006,2005,2004,2003,2002,2001,2000,1999,1998,1997,1996,1995,1994,1993,1992,1991,1990,1989,1988,1987,1986,1985,1984,1983,1982,1981,1980,1979,1978,1977,1976,1975,1974,1973,1972,1971,1970,1969,1968,1967,1966
This statistics in other country:
AfghanistanAlbaniaAndorraAntigua and BarbudaArab WorldArgentinaArmeniaArubaAustraliaAustriaAzerbaijanBahamas, TheBahrainBangladeshBarbadosBelarusBelgiumBelizeBeninBermudaBhutanBoliviaBosnia and HerzegovinaBotswanaBrazilBrunei DarussalamBurkina FasoBurundiCambodiaCameroonCanadaCaribbean small statesCentral African RepublicCentral Europe and the BalticsChadChileChinaColombiaComorosCongo, Dem. Rep.Congo, Rep.Costa RicaCote d'IvoireCroatiaCubaCyprusCzech RepublicDenmarkDominicaDominican RepublicEarly-demographic dividendEast Asia & PacificEast Asia & Pacific (excluding high income)East Asia & Pacific (IDA & IBRD countries)EcuadorEgypt, Arab Rep.El SalvadorEquatorial GuineaEstoniaEthiopiaEuro areaEurope & Central AsiaEurope & Central Asia (excluding high income)Europe & Central Asia (IDA & IBRD countries)European UnionFaroe IslandsFijiFinlandFragile and conflict affected situationsFranceGabonGambia, TheGeorgiaGermanyGhanaGreeceGrenadaGuatemalaGuineaGuyanaHeavily indebted poor countries (HIPC)High incomeHondurasHong Kong SAR, ChinaHungaryIBRD onlyIcelandIDA & IBRD totalIDA blendIDA onlyIDA totalIndiaIndonesiaIran, Islamic Rep.IraqIrelandItalyJamaicaJapanJordanKazakhstanKenyaKiribatiKorea, Rep.KosovoKuwaitKyrgyz RepublicLao PDRLate-demographic dividendLatin America & Caribbean Latin America & Caribbean (excluding high income)Latin America & the Caribbean (IDA & IBRD countries)LatviaLeast developed countries: UN classificationLebanonLesothoLiberiaLithuaniaLow & middle incomeLow incomeLower middle incomeLuxembourgMacao SAR, ChinaMacedonia, FYRMalawiMalaysiaMaldivesMaltaMarshall IslandsMauritaniaMauritiusMexicoMicronesia, Fed. Sts.Middle East & North AfricaMiddle East & North Africa (excluding high income)Middle East & North Africa (IDA & IBRD countries)Middle incomeMoldovaMongoliaMontenegroMoroccoMozambiqueMyanmarNamibiaNepalNetherlandsNew ZealandNicaraguaNigerNigeriaNorth AmericaNorwayOECD membersOmanOther small statesPacific island small statesPakistanPalauPanamaParaguayPeruPhilippinesPolandPortugalPost-demographic dividendPre-demographic dividendPuerto RicoQatarRomaniaRussian FederationRwandaSamoaSao Tome and PrincipeSaudi ArabiaSenegalSerbiaSeychellesSierra LeoneSingaporeSlovak RepublicSloveniaSmall statesSouth AfricaSouth AsiaSouth Asia (IDA & IBRD)SpainSri LankaSt. Kitts and NevisSt. LuciaSt. Vincent and the GrenadinesSub-Saharan Africa Sub-Saharan Africa (excluding high income)Sub-Saharan Africa (IDA & IBRD countries)SudanSurinameSwazilandSwedenSwitzerlandTajikistanTanzaniaThailandTimor-LesteTogoTongaTrinidad and TobagoTunisiaTurkeyTuvaluUgandaUkraineUnited Arab EmiratesUnited KingdomUnited StatesUpper middle incomeUruguayUzbekistanVanuatuVenezuela, RBVietnamWest Bank and GazaWorldYemen, Rep.ZambiaZimbabwe Timeline:
This timeline shows a graph from 1966 to 2016 of Fiji. No data until 1965. Number of actual observations by date: 51.
Source name:
World Development Indicators
Source organization:
World Bank national accounts data, and OECD National Accounts data files.
Categories, topics:
Economy & Growth
Last updated:
apr 23, 2017
Indicators value changes by year
Minimum:
71.053 mln
jan 1, 1967
Maximum:
419.497 mln
jan 1, 2016
At the date of observation
Value
Absolute change
Change from previous value
jan 1, 1966
85.154 mln
+85.154 mln
0.0%
jan 1, 1967
71.053 mln
-14.101 mln
-16.56%
jan 1, 1968
109.327 mln
+38.273 mln
53.87%
jan 1, 1969
114.088 mln
+4.761 mln
4.36%
jan 1, 1970
91.563 mln
-22.525 mln
-19.74%
jan 1, 1971
104.382 mln
+12.819 mln
14.0%
jan 1, 1972
95.409 mln
-8.973 mln
-8.6%
jan 1, 1973
99.621 mln
+4.212 mln
4.41%
jan 1, 1974
102.917 mln
+3.296 mln
3.31%
jan 1, 1975
106.58 mln
+3.663 mln
3.56%
jan 1, 1976
107.129 mln
+549.382K
0.52%
jan 1, 1977
116.285 mln
+9.156 mln
8.55%
jan 1, 1978
127.09 mln
+10.804 mln
9.29%
jan 1, 1979
136.063 mln
+8.973 mln
7.06%
jan 1, 1980
160.602 mln
+24.539 mln
18.03%
jan 1, 1981
147.966 mln
-12.636 mln
-7.87%
jan 1, 1982
162.799 mln
+14.833 mln
10.02%
jan 1, 1983
158.221 mln
-4.578 mln
-2.81%
jan 1, 1984
142.289 mln
-15.932 mln
-10.07%
jan 1, 1985
166.645 mln
+24.356 mln
17.12%
jan 1, 1986
145.219 mln
-21.426 mln
-12.86%
jan 1, 1987
173.238 mln
+28.018 mln
19.29%
jan 1, 1988
153.643 mln
-19.595 mln
-11.31%
jan 1, 1989
152.361 mln
-1.282 mln
-0.83%
jan 1, 1990
192.494 mln
+40.133 mln
26.34%
jan 1, 1991
212.501 mln
+20.007 mln
10.39%
jan 1, 1992
212.573 mln
+72.038K
0.03%
jan 1, 1993
216.855 mln
+4.283 mln
2.01%
jan 1, 1994
243.038 mln
+26.182 mln
12.07%
jan 1, 1995
260.168 mln
+17.13 mln
7.05%
jan 1, 1996
260.557 mln
+389.299K
0.15%
jan 1, 1997
273.0 mln
+12.443 mln
4.78%
jan 1, 1998
295.382 mln
+22.382 mln
8.2%
jan 1, 1999
310.593 mln
+15.21 mln
5.15%
jan 1, 2000
333.684 mln
+23.091 mln
7.43%
jan 1, 2001
315.479 mln
-18.205 mln
-5.46%
jan 1, 2002
354.569 mln
+39.09 mln
12.39%
jan 1, 2003
357.406 mln
+2.837 mln
0.8%
jan 1, 2004
353.781 mln
-3.625 mln
-1.01%
jan 1, 2005
399.176 mln
+45.395 mln
12.83%
jan 1, 2006
337.546 mln
-61.63 mln
-15.44%
jan 1, 2007
361.229 mln
+23.684 mln
7.02%
jan 1, 2008
339.519 mln
-21.71 mln
-6.01%
jan 1, 2009
374.184 mln
+34.664 mln
10.21%
jan 1, 2010
369.089 mln
-5.095 mln
-1.36%
jan 1, 2011
386.61 mln
+17.521 mln
4.75%
jan 1, 2012
395.613 mln
+9.003 mln
2.33%
jan 1, 2013
388.026 mln
-7.587 mln
-1.92%
jan 1, 2014
410.854 mln
+22.828 mln
5.88%
jan 1, 2015
415.989 mln
+5.135 mln
1.25%
jan 1, 2016
419.497 mln
+3.509 mln
0.84%
Ranking of countries by current statistics by years


Comments: