29
/
en
AIzaSyAYiBZKx7MnpbEhh9jyipgxe19OcubqV5w
April 1, 2024
213221
Nigeria
NGA
true
2
1
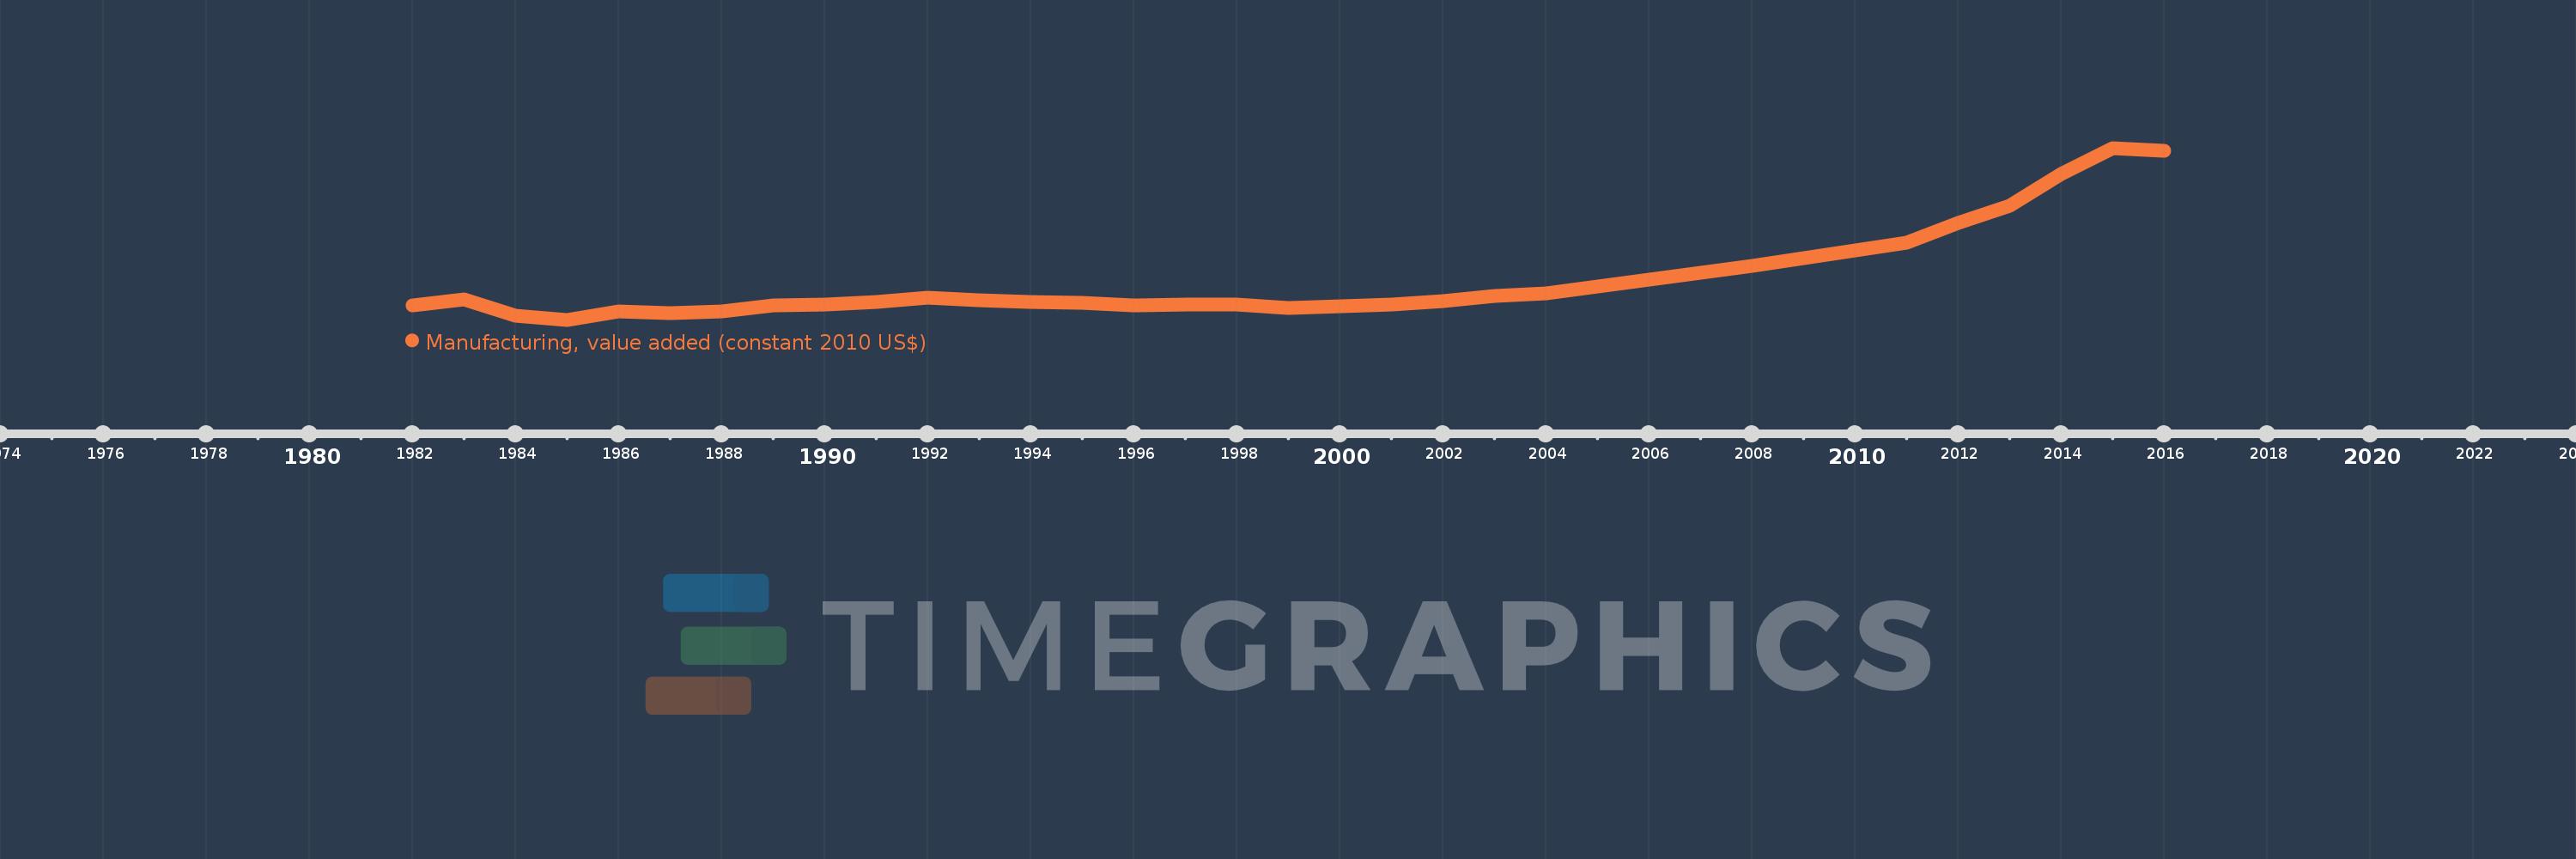
Manufacturing, value added (constant 2010 US$)
2016,2015,2014,2013,2012,2011,2010,2009,2008,2007,2006,2005,2004,2003,2002,2001,2000,1999,1998,1997,1996,1995,1994,1993,1992,1991,1990,1989,1988,1987,1986,1985,1984,1983,1982
This statistics in other country:
AfghanistanAlbaniaAndorraAntigua and BarbudaArab WorldArgentinaArmeniaArubaAustraliaAustriaAzerbaijanBahamas, TheBahrainBangladeshBarbadosBelarusBelgiumBelizeBeninBermudaBhutanBoliviaBosnia and HerzegovinaBotswanaBrazilBrunei DarussalamBurkina FasoBurundiCambodiaCameroonCanadaCaribbean small statesCentral African RepublicCentral Europe and the BalticsChadChileChinaColombiaComorosCongo, Dem. Rep.Congo, Rep.Costa RicaCote d'IvoireCroatiaCubaCyprusCzech RepublicDenmarkDominicaDominican RepublicEarly-demographic dividendEast Asia & PacificEast Asia & Pacific (excluding high income)East Asia & Pacific (IDA & IBRD countries)EcuadorEgypt, Arab Rep.El SalvadorEquatorial GuineaEstoniaEthiopiaEuro areaEurope & Central AsiaEurope & Central Asia (excluding high income)Europe & Central Asia (IDA & IBRD countries)European UnionFaroe IslandsFijiFinlandFragile and conflict affected situationsFranceGabonGambia, TheGeorgiaGermanyGhanaGreeceGrenadaGuatemalaGuineaGuyanaHeavily indebted poor countries (HIPC)High incomeHondurasHong Kong SAR, ChinaHungaryIBRD onlyIcelandIDA & IBRD totalIDA blendIDA onlyIDA totalIndiaIndonesiaIran, Islamic Rep.IraqIrelandItalyJamaicaJapanJordanKazakhstanKenyaKiribatiKorea, Rep.KosovoKuwaitKyrgyz RepublicLao PDRLate-demographic dividendLatin America & Caribbean Latin America & Caribbean (excluding high income)Latin America & the Caribbean (IDA & IBRD countries)LatviaLeast developed countries: UN classificationLebanonLesothoLiberiaLithuaniaLow & middle incomeLow incomeLower middle incomeLuxembourgMacao SAR, ChinaMacedonia, FYRMalawiMalaysiaMaldivesMaltaMarshall IslandsMauritaniaMauritiusMexicoMicronesia, Fed. Sts.Middle East & North AfricaMiddle East & North Africa (excluding high income)Middle East & North Africa (IDA & IBRD countries)Middle incomeMoldovaMongoliaMontenegroMoroccoMozambiqueMyanmarNamibiaNepalNetherlandsNew ZealandNicaraguaNigerNigeriaNorth AmericaNorwayOECD membersOmanOther small statesPacific island small statesPakistanPalauPanamaParaguayPeruPhilippinesPolandPortugalPost-demographic dividendPre-demographic dividendPuerto RicoQatarRomaniaRussian FederationRwandaSamoaSao Tome and PrincipeSaudi ArabiaSenegalSerbiaSeychellesSierra LeoneSingaporeSlovak RepublicSloveniaSmall statesSouth AfricaSouth AsiaSouth Asia (IDA & IBRD)SpainSri LankaSt. Kitts and NevisSt. LuciaSt. Vincent and the GrenadinesSub-Saharan Africa Sub-Saharan Africa (excluding high income)Sub-Saharan Africa (IDA & IBRD countries)SudanSurinameSwazilandSwedenSwitzerlandTajikistanTanzaniaThailandTimor-LesteTogoTongaTrinidad and TobagoTunisiaTurkeyTuvaluUgandaUkraineUnited Arab EmiratesUnited KingdomUnited StatesUpper middle incomeUruguayUzbekistanVanuatuVenezuela, RBVietnamWest Bank and GazaWorldYemen, Rep.ZambiaZimbabwe Timeline:
This timeline shows a graph from 1982 to 2016 of Nigeria. No data until 1981. Number of actual observations by date: 35.
Source name:
World Development Indicators
Source organization:
World Bank national accounts data, and OECD National Accounts data files.
Categories, topics:
Economy & Growth
Last updated:
apr 23, 2017
Indicators value changes by year
Minimum:
7.036 bln
jan 1, 1985
Maximum:
44.473 bln
jan 1, 2015
At the date of observation
Value
Absolute change
Change from previous value
jan 1, 1982
10.213 bln
+10.213 bln
0.0%
jan 1, 1983
11.539 bln
+1.325 bln
12.98%
jan 1, 1984
7.969 bln
-3.569 bln
-30.93%
jan 1, 1985
7.036 bln
-933.404 mln
-11.71%
jan 1, 1986
8.881 bln
+1.845 bln
26.22%
jan 1, 1987
8.549 bln
-331.965 mln
-3.74%
jan 1, 1988
8.887 bln
+338.763 mln
3.96%
jan 1, 1989
10.122 bln
+1.234 bln
13.89%
jan 1, 1990
10.341 bln
+219.647 mln
2.17%
jan 1, 1991
10.851 bln
+509.934 mln
4.93%
jan 1, 1992
11.867 bln
+1.016 bln
9.36%
jan 1, 1993
11.335 bln
-532.341 mln
-4.49%
jan 1, 1994
10.915 bln
-419.994 mln
-3.71%
jan 1, 1995
10.769 bln
-145.228 mln
-1.33%
jan 1, 1996
10.212 bln
-557.398 mln
-5.18%
jan 1, 1997
10.298 bln
+86.56 mln
0.85%
jan 1, 1998
10.34 bln
+41.723 mln
0.41%
jan 1, 1999
9.629 bln
-711.233 mln
-6.88%
jan 1, 2000
9.96 bln
+330.902 mln
3.44%
jan 1, 2001
10.302 bln
+342.593 mln
3.44%
jan 1, 2002
11.023 bln
+720.554 mln
6.99%
jan 1, 2003
12.133 bln
+1.11 bln
10.07%
jan 1, 2004
12.82 bln
+686.596 mln
5.66%
jan 1, 2005
14.346 bln
+1.526 bln
11.9%
jan 1, 2006
15.724 bln
+1.379 bln
9.61%
jan 1, 2007
17.201 bln
+1.477 bln
9.39%
jan 1, 2008
18.847 bln
+1.646 bln
9.57%
jan 1, 2009
20.523 bln
+1.676 bln
8.89%
jan 1, 2010
22.135 bln
+1.612 bln
7.85%
jan 1, 2011
23.81 bln
+1.675 bln
7.57%
jan 1, 2012
28.052 bln
+4.242 bln
17.82%
jan 1, 2013
31.828 bln
+3.776 bln
13.46%
jan 1, 2014
38.765 bln
+6.938 bln
21.8%
jan 1, 2015
44.473 bln
+5.708 bln
14.72%
jan 1, 2016
43.824 bln
-649.372 mln
-1.46%
Ranking of countries by current statistics by years


Comments: