29
/
en
AIzaSyAYiBZKx7MnpbEhh9jyipgxe19OcubqV5w
April 1, 2024
50197
Middle East & North Africa (IDA & IBRD countries)
TMN
false
2
1
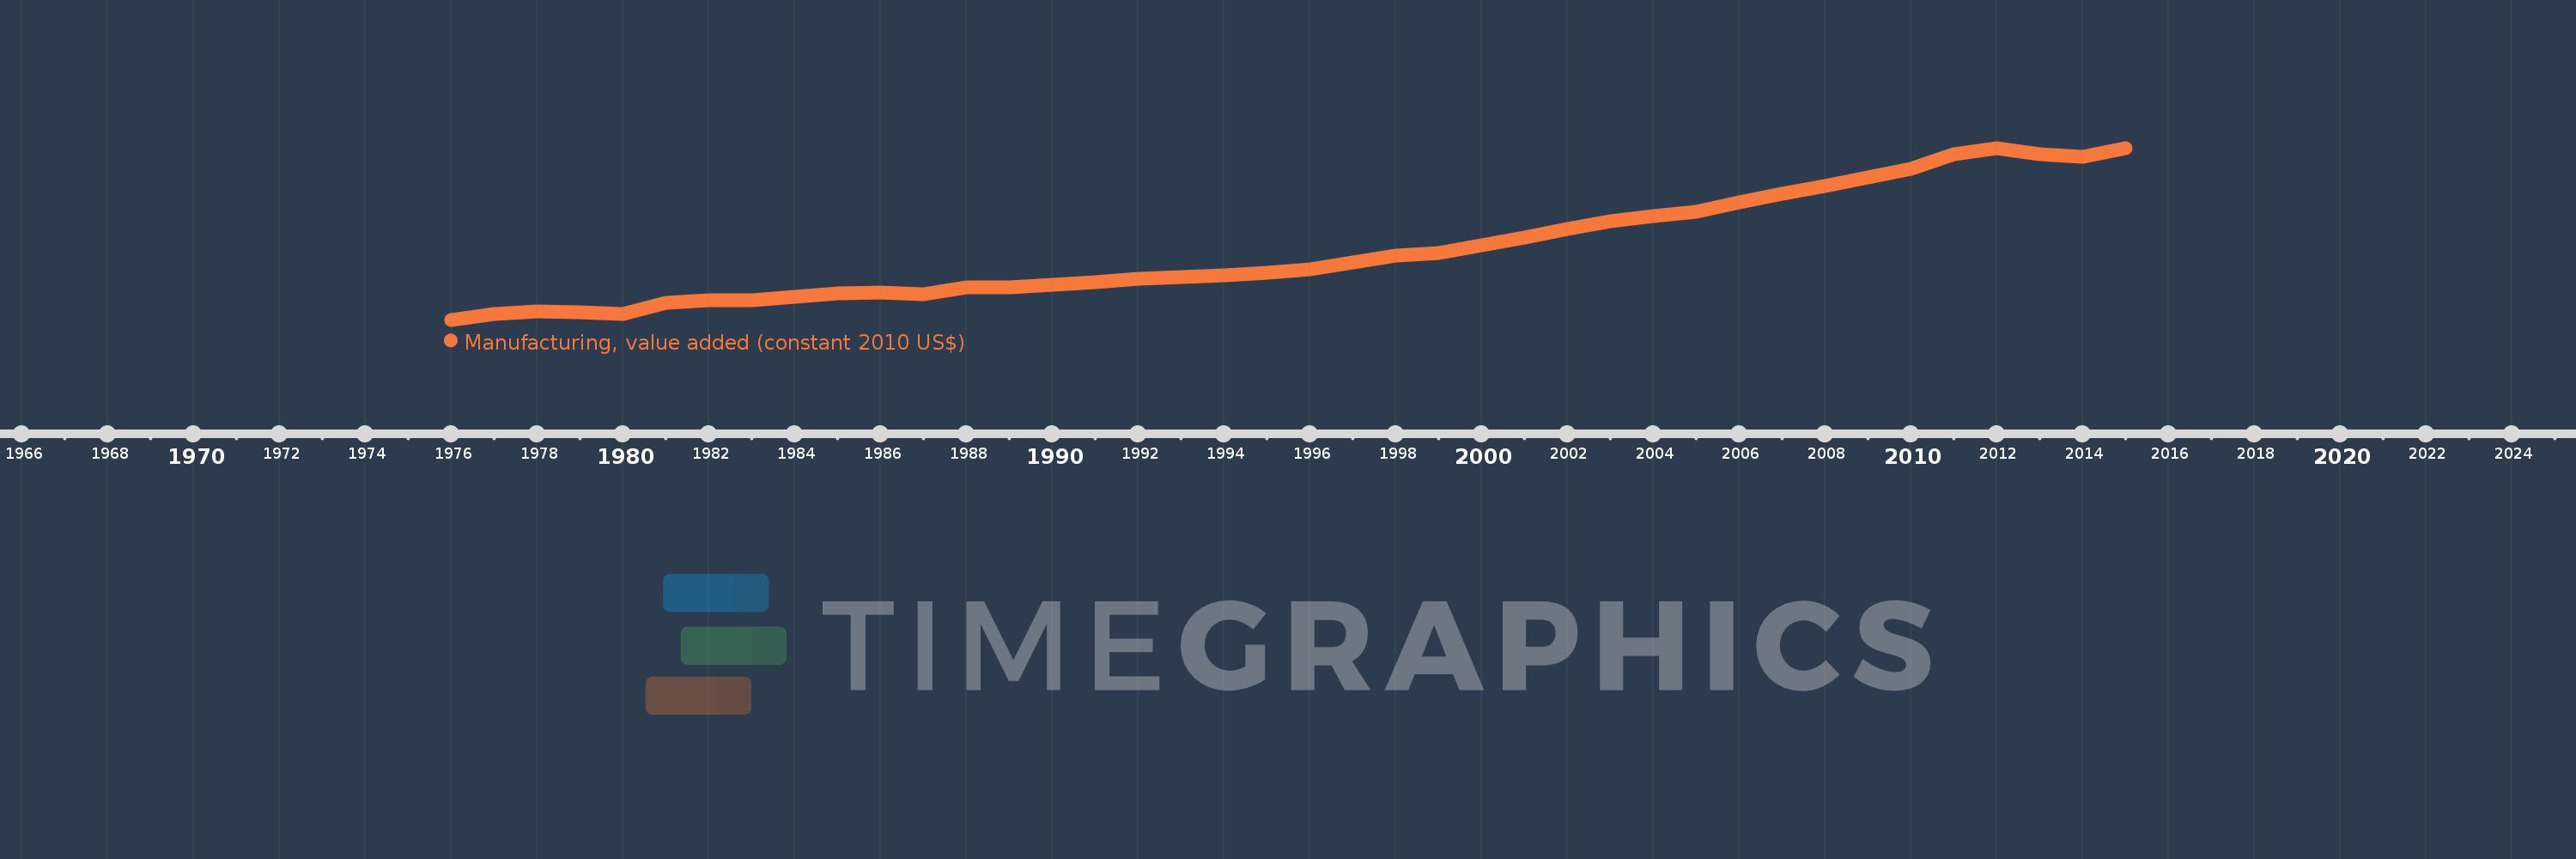
Manufacturing, value added (constant 2010 US$)
2015,2014,2013,2012,2011,2010,2009,2008,2007,2006,2005,2004,2003,2002,2001,2000,1999,1998,1997,1996,1995,1994,1993,1992,1991,1990,1989,1988,1987,1986,1985,1984,1983,1982,1981,1980,1979,1978,1977,1976
This statistics in other country:
AfghanistanAlbaniaAndorraAntigua and BarbudaArab WorldArgentinaArmeniaArubaAustraliaAustriaAzerbaijanBahamas, TheBahrainBangladeshBarbadosBelarusBelgiumBelizeBeninBermudaBhutanBoliviaBosnia and HerzegovinaBotswanaBrazilBrunei DarussalamBurkina FasoBurundiCambodiaCameroonCanadaCaribbean small statesCentral African RepublicCentral Europe and the BalticsChadChileChinaColombiaComorosCongo, Dem. Rep.Congo, Rep.Costa RicaCote d'IvoireCroatiaCubaCyprusCzech RepublicDenmarkDominicaDominican RepublicEarly-demographic dividendEast Asia & PacificEast Asia & Pacific (excluding high income)East Asia & Pacific (IDA & IBRD countries)EcuadorEgypt, Arab Rep.El SalvadorEquatorial GuineaEstoniaEthiopiaEuro areaEurope & Central AsiaEurope & Central Asia (excluding high income)Europe & Central Asia (IDA & IBRD countries)European UnionFaroe IslandsFijiFinlandFragile and conflict affected situationsFranceGabonGambia, TheGeorgiaGermanyGhanaGreeceGrenadaGuatemalaGuineaGuyanaHeavily indebted poor countries (HIPC)High incomeHondurasHong Kong SAR, ChinaHungaryIBRD onlyIcelandIDA & IBRD totalIDA blendIDA onlyIDA totalIndiaIndonesiaIran, Islamic Rep.IraqIrelandItalyJamaicaJapanJordanKazakhstanKenyaKiribatiKorea, Rep.KosovoKuwaitKyrgyz RepublicLao PDRLate-demographic dividendLatin America & Caribbean Latin America & Caribbean (excluding high income)Latin America & the Caribbean (IDA & IBRD countries)LatviaLeast developed countries: UN classificationLebanonLesothoLiberiaLithuaniaLow & middle incomeLow incomeLower middle incomeLuxembourgMacao SAR, ChinaMacedonia, FYRMalawiMalaysiaMaldivesMaltaMarshall IslandsMauritaniaMauritiusMexicoMicronesia, Fed. Sts.Middle East & North AfricaMiddle East & North Africa (excluding high income)Middle East & North Africa (IDA & IBRD countries)Middle incomeMoldovaMongoliaMontenegroMoroccoMozambiqueMyanmarNamibiaNepalNetherlandsNew ZealandNicaraguaNigerNigeriaNorth AmericaNorwayOECD membersOmanOther small statesPacific island small statesPakistanPalauPanamaParaguayPeruPhilippinesPolandPortugalPost-demographic dividendPre-demographic dividendPuerto RicoQatarRomaniaRussian FederationRwandaSamoaSao Tome and PrincipeSaudi ArabiaSenegalSerbiaSeychellesSierra LeoneSingaporeSlovak RepublicSloveniaSmall statesSouth AfricaSouth AsiaSouth Asia (IDA & IBRD)SpainSri LankaSt. Kitts and NevisSt. LuciaSt. Vincent and the GrenadinesSub-Saharan Africa Sub-Saharan Africa (excluding high income)Sub-Saharan Africa (IDA & IBRD countries)SudanSurinameSwazilandSwedenSwitzerlandTajikistanTanzaniaThailandTimor-LesteTogoTongaTrinidad and TobagoTunisiaTurkeyTuvaluUgandaUkraineUnited Arab EmiratesUnited KingdomUnited StatesUpper middle incomeUruguayUzbekistanVanuatuVenezuela, RBVietnamWest Bank and GazaWorldYemen, Rep.ZambiaZimbabwe Timeline:
This timeline shows a graph from 1976 to 2015 of Middle East & North Africa (IDA & IBRD countries). No data until 1975. Number of actual observations by date: 40.
Source name:
World Development Indicators
Source organization:
World Bank national accounts data, and OECD National Accounts data files.
Categories, topics:
Economy & Growth
Last updated:
apr 23, 2017
Indicators value changes by year
Minimum:
20.383 bln
jan 1, 1976
Maximum:
142.283 bln
jan 1, 2015
At the date of observation
Value
Absolute change
Change from previous value
jan 1, 1976
20.383 bln
+20.383 bln
0.0%
jan 1, 1977
24.63 bln
+4.247 bln
20.83%
jan 1, 1978
26.092 bln
+1.462 bln
5.94%
jan 1, 1979
25.467 bln
-625.072 mln
-2.4%
jan 1, 1980
24.61 bln
-856.329 mln
-3.36%
jan 1, 1981
32.428 bln
+7.818 bln
31.77%
jan 1, 1982
34.278 bln
+1.85 bln
5.71%
jan 1, 1983
34.153 bln
-125.632 mln
-0.37%
jan 1, 1984
36.469 bln
+2.317 bln
6.78%
jan 1, 1985
38.807 bln
+2.338 bln
6.41%
jan 1, 1986
39.706 bln
+898.396 mln
2.32%
jan 1, 1987
38.625 bln
-1.08 bln
-2.72%
jan 1, 1988
43.214 bln
+4.589 bln
11.88%
jan 1, 1989
43.268 bln
+53.702 mln
0.12%
jan 1, 1990
45.456 bln
+2.189 bln
5.06%
jan 1, 1991
46.862 bln
+1.406 bln
3.09%
jan 1, 1992
49.569 bln
+2.707 bln
5.78%
jan 1, 1993
50.442 bln
+872.482 mln
1.76%
jan 1, 1994
51.638 bln
+1.196 bln
2.37%
jan 1, 1995
53.942 bln
+2.304 bln
4.46%
jan 1, 1996
56.247 bln
+2.305 bln
4.27%
jan 1, 1997
61.204 bln
+4.958 bln
8.81%
jan 1, 1998
66.163 bln
+4.959 bln
8.1%
jan 1, 1999
67.831 bln
+1.668 bln
2.52%
jan 1, 2000
73.214 bln
+5.383 bln
7.94%
jan 1, 2001
78.687 bln
+5.472 bln
7.47%
jan 1, 2002
84.687 bln
+6.0 bln
7.63%
jan 1, 2003
90.522 bln
+5.834 bln
6.89%
jan 1, 2004
94.252 bln
+3.73 bln
4.12%
jan 1, 2005
96.856 bln
+2.604 bln
2.76%
jan 1, 2006
103.415 bln
+6.559 bln
6.77%
jan 1, 2007
110.062 bln
+6.646 bln
6.43%
jan 1, 2008
115.484 bln
+5.422 bln
4.93%
jan 1, 2009
121.648 bln
+6.164 bln
5.34%
jan 1, 2010
127.595 bln
+5.947 bln
4.89%
jan 1, 2011
137.673 bln
+10.078 bln
7.9%
jan 1, 2012
142.0 bln
+4.328 bln
3.14%
jan 1, 2013
137.598 bln
-4.402 bln
-3.1%
jan 1, 2014
136.071 bln
-1.527 bln
-1.11%
jan 1, 2015
142.283 bln
+6.212 bln
4.57%
Ranking of countries by current statistics by years


Comments: