29
/
en
AIzaSyAYiBZKx7MnpbEhh9jyipgxe19OcubqV5w
April 1, 2024
216696
Pakistan
PAK
true
2
1
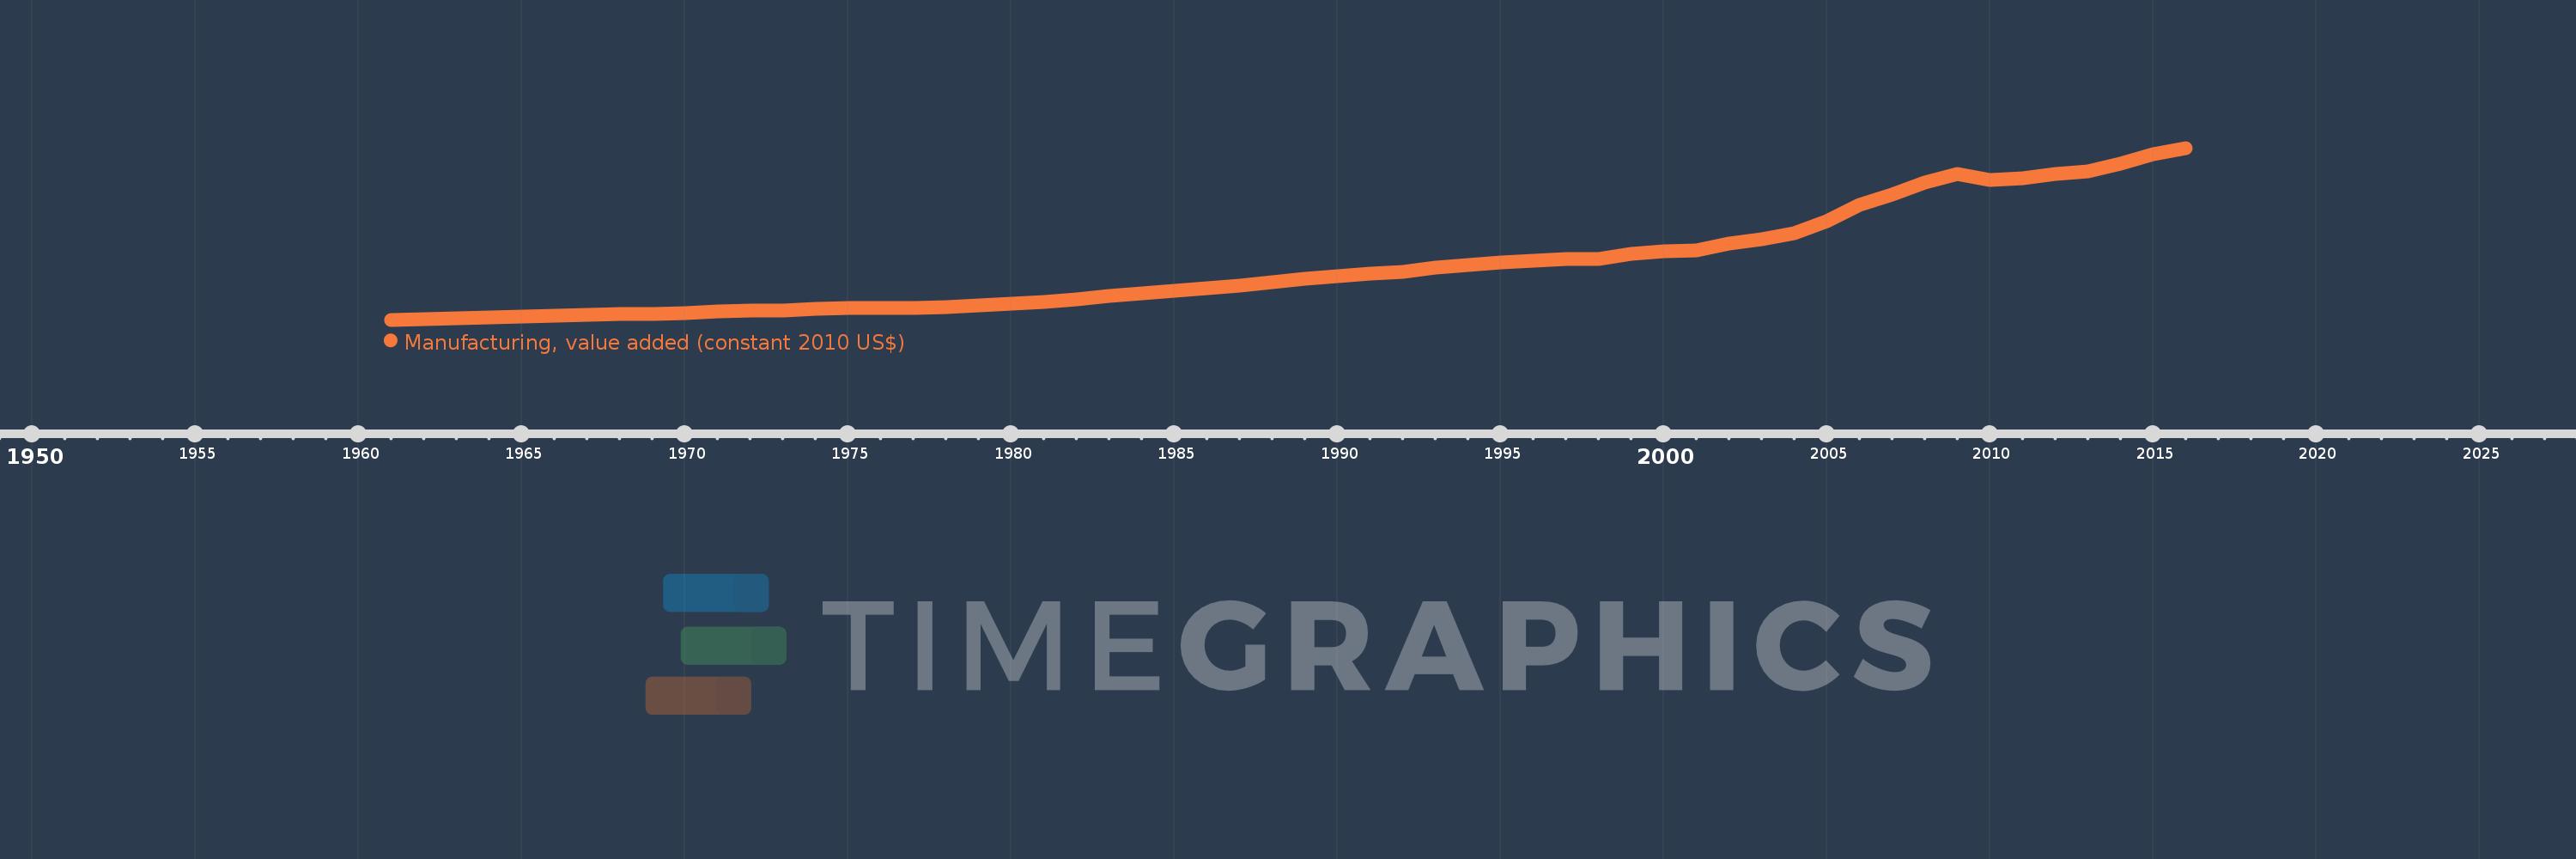
Manufacturing, value added (constant 2010 US$)
2016,2015,2014,2013,2012,2011,2010,2009,2008,2007,2006,2005,2004,2003,2002,2001,2000,1999,1998,1997,1996,1995,1994,1993,1992,1991,1990,1989,1988,1987,1986,1985,1984,1983,1982,1981,1980,1979,1978,1977,1976,1975,1974,1973,1972,1971,1970,1969,1968,1967,1966,1965,1964,1963,1962,1961
This statistics in other country:
AfghanistanAlbaniaAndorraAntigua and BarbudaArab WorldArgentinaArmeniaArubaAustraliaAustriaAzerbaijanBahamas, TheBahrainBangladeshBarbadosBelarusBelgiumBelizeBeninBermudaBhutanBoliviaBosnia and HerzegovinaBotswanaBrazilBrunei DarussalamBurkina FasoBurundiCambodiaCameroonCanadaCaribbean small statesCentral African RepublicCentral Europe and the BalticsChadChileChinaColombiaComorosCongo, Dem. Rep.Congo, Rep.Costa RicaCote d'IvoireCroatiaCubaCyprusCzech RepublicDenmarkDominicaDominican RepublicEarly-demographic dividendEast Asia & PacificEast Asia & Pacific (excluding high income)East Asia & Pacific (IDA & IBRD countries)EcuadorEgypt, Arab Rep.El SalvadorEquatorial GuineaEstoniaEthiopiaEuro areaEurope & Central AsiaEurope & Central Asia (excluding high income)Europe & Central Asia (IDA & IBRD countries)European UnionFaroe IslandsFijiFinlandFragile and conflict affected situationsFranceGabonGambia, TheGeorgiaGermanyGhanaGreeceGrenadaGuatemalaGuineaGuyanaHeavily indebted poor countries (HIPC)High incomeHondurasHong Kong SAR, ChinaHungaryIBRD onlyIcelandIDA & IBRD totalIDA blendIDA onlyIDA totalIndiaIndonesiaIran, Islamic Rep.IraqIrelandItalyJamaicaJapanJordanKazakhstanKenyaKiribatiKorea, Rep.KosovoKuwaitKyrgyz RepublicLao PDRLate-demographic dividendLatin America & Caribbean Latin America & Caribbean (excluding high income)Latin America & the Caribbean (IDA & IBRD countries)LatviaLeast developed countries: UN classificationLebanonLesothoLiberiaLithuaniaLow & middle incomeLow incomeLower middle incomeLuxembourgMacao SAR, ChinaMacedonia, FYRMalawiMalaysiaMaldivesMaltaMarshall IslandsMauritaniaMauritiusMexicoMicronesia, Fed. Sts.Middle East & North AfricaMiddle East & North Africa (excluding high income)Middle East & North Africa (IDA & IBRD countries)Middle incomeMoldovaMongoliaMontenegroMoroccoMozambiqueMyanmarNamibiaNepalNetherlandsNew ZealandNicaraguaNigerNigeriaNorth AmericaNorwayOECD membersOmanOther small statesPacific island small statesPakistanPalauPanamaParaguayPeruPhilippinesPolandPortugalPost-demographic dividendPre-demographic dividendPuerto RicoQatarRomaniaRussian FederationRwandaSamoaSao Tome and PrincipeSaudi ArabiaSenegalSerbiaSeychellesSierra LeoneSingaporeSlovak RepublicSloveniaSmall statesSouth AfricaSouth AsiaSouth Asia (IDA & IBRD)SpainSri LankaSt. Kitts and NevisSt. LuciaSt. Vincent and the GrenadinesSub-Saharan Africa Sub-Saharan Africa (excluding high income)Sub-Saharan Africa (IDA & IBRD countries)SudanSurinameSwazilandSwedenSwitzerlandTajikistanTanzaniaThailandTimor-LesteTogoTongaTrinidad and TobagoTunisiaTurkeyTuvaluUgandaUkraineUnited Arab EmiratesUnited KingdomUnited StatesUpper middle incomeUruguayUzbekistanVanuatuVenezuela, RBVietnamWest Bank and GazaWorldYemen, Rep.ZambiaZimbabwe Timeline:
This timeline shows a graph from 1961 to 2016 of Pakistan. No data until 1960. Number of actual observations by date: 56.
Source name:
World Development Indicators
Source organization:
World Bank national accounts data, and OECD National Accounts data files.
Categories, topics:
Economy & Growth
Last updated:
apr 23, 2017
Indicators value changes by year
Minimum:
847.819 mln
jan 1, 1961
Maximum:
27.933 bln
jan 1, 2016
At the date of observation
Value
Absolute change
Change from previous value
jan 1, 1961
847.819 mln
+847.819 mln
0.0%
jan 1, 1962
956.154 mln
+108.335 mln
12.78%
jan 1, 1963
1.082 bln
+125.988 mln
13.18%
jan 1, 1964
1.203 bln
+121.247 mln
11.2%
jan 1, 1965
1.34 bln
+136.781 mln
11.37%
jan 1, 1966
1.473 bln
+133.049 mln
9.93%
jan 1, 1967
1.6 bln
+126.611 mln
8.59%
jan 1, 1968
1.69 bln
+90.556 mln
5.66%
jan 1, 1969
1.798 bln
+107.745 mln
6.37%
jan 1, 1970
1.953 bln
+155.12 mln
8.63%
jan 1, 1971
2.175 bln
+221.36 mln
11.33%
jan 1, 1972
2.315 bln
+140.027 mln
6.44%
jan 1, 1973
2.344 bln
+28.928 mln
1.25%
jan 1, 1974
2.548 bln
+204.59 mln
8.73%
jan 1, 1975
2.71 bln
+161.828 mln
6.35%
jan 1, 1976
2.724 bln
+14.254 mln
0.53%
jan 1, 1977
2.762 bln
+37.732 mln
1.39%
jan 1, 1978
2.812 bln
+49.89 mln
1.81%
jan 1, 1979
3.099 bln
+287.181 mln
10.21%
jan 1, 1980
3.347 bln
+248.192 mln
8.01%
jan 1, 1981
3.691 bln
+343.36 mln
10.26%
jan 1, 1982
4.083 bln
+392.411 mln
10.63%
jan 1, 1983
4.645 bln
+561.541 mln
13.75%
jan 1, 1984
4.971 bln
+326.675 mln
7.03%
jan 1, 1985
5.363 bln
+391.988 mln
7.89%
jan 1, 1986
5.797 bln
+433.858 mln
8.09%
jan 1, 1987
6.235 bln
+437.675 mln
7.55%
jan 1, 1988
6.704 bln
+469.295 mln
7.53%
jan 1, 1989
7.373 bln
+669.269 mln
9.98%
jan 1, 1990
7.665 bln
+292.001 mln
3.96%
jan 1, 1991
8.104 bln
+438.765 mln
5.72%
jan 1, 1992
8.408 bln
+303.559 mln
3.75%
jan 1, 1993
9.015 bln
+607.009 mln
7.22%
jan 1, 1994
9.415 bln
+400.275 mln
4.44%
jan 1, 1995
9.843 bln
+428.08 mln
4.55%
jan 1, 1996
10.093 bln
+249.586 mln
2.54%
jan 1, 1997
10.469 bln
+376.723 mln
3.73%
jan 1, 1998
10.462 bln
-7.742 mln
-0.07%
jan 1, 1999
11.186 bln
+724.878 mln
6.93%
jan 1, 2000
11.642 bln
+455.121 mln
4.07%
jan 1, 2001
11.82 bln
+178.603 mln
1.53%
jan 1, 2002
12.918 bln
+1.098 bln
9.29%
jan 1, 2003
13.494 bln
+576.175 mln
4.46%
jan 1, 2004
14.426 bln
+931.571 mln
6.9%
jan 1, 2005
16.447 bln
+2.021 bln
14.01%
jan 1, 2006
18.997 bln
+2.55 bln
15.51%
jan 1, 2007
20.641 bln
+1.644 bln
8.65%
jan 1, 2008
22.506 bln
+1.864 bln
9.03%
jan 1, 2009
23.879 bln
+1.373 bln
6.1%
jan 1, 2010
22.882 bln
-997.182 mln
-4.18%
jan 1, 2011
23.196 bln
+313.865 mln
1.37%
jan 1, 2012
23.776 bln
+579.872 mln
2.5%
jan 1, 2013
24.271 bln
+495.607 mln
2.08%
jan 1, 2014
25.447 bln
+1.176 bln
4.85%
jan 1, 2015
26.885 bln
+1.437 bln
5.65%
jan 1, 2016
27.933 bln
+1.049 bln
3.9%
Ranking of countries by current statistics by years


Comments: