29
/
en
AIzaSyAYiBZKx7MnpbEhh9jyipgxe19OcubqV5w
April 1, 2024
33618
European Union
EUU
false
2
1
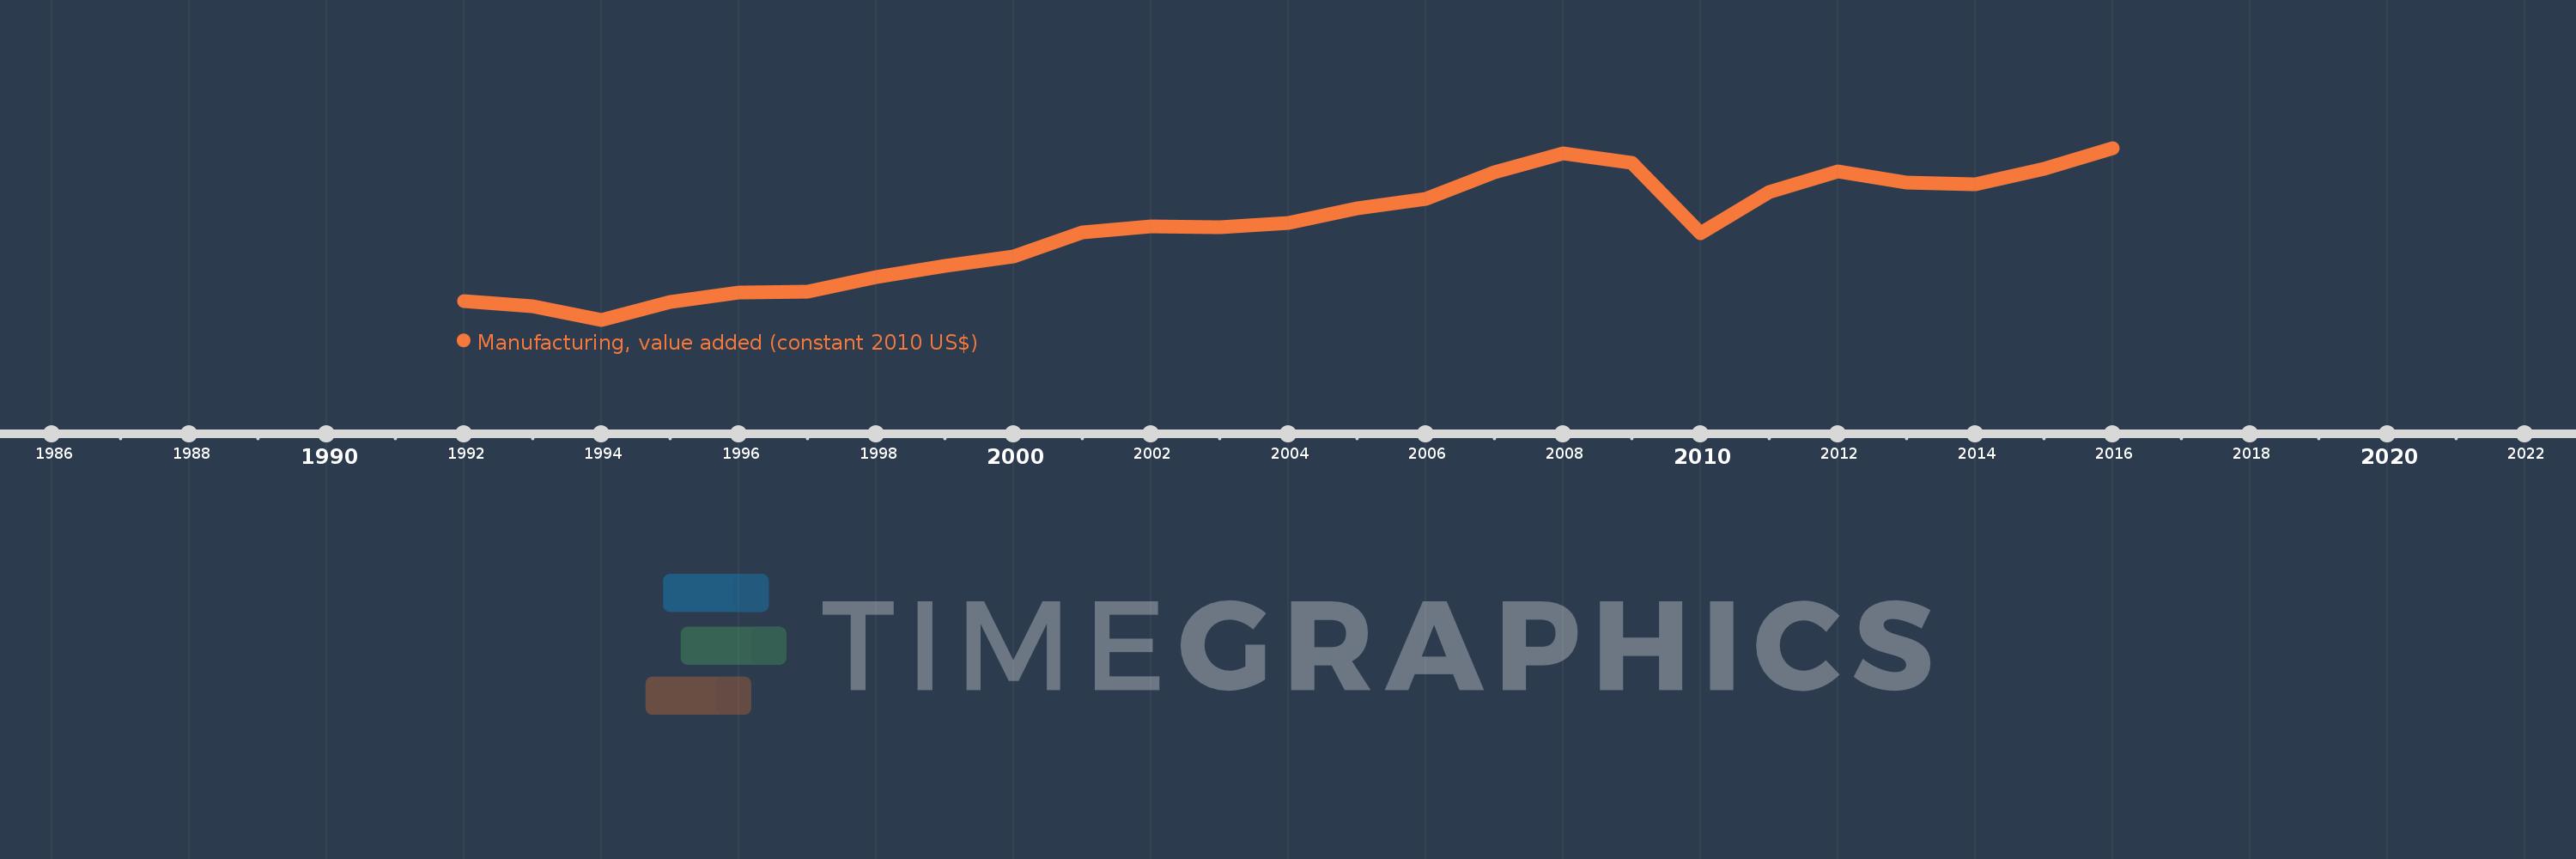
Manufacturing, value added (constant 2010 US$)
2016,2015,2014,2013,2012,2011,2010,2009,2008,2007,2006,2005,2004,2003,2002,2001,2000,1999,1998,1997,1996,1995,1994,1993,1992
This statistics in other country:
AfghanistanAlbaniaAndorraAntigua and BarbudaArab WorldArgentinaArmeniaArubaAustraliaAustriaAzerbaijanBahamas, TheBahrainBangladeshBarbadosBelarusBelgiumBelizeBeninBermudaBhutanBoliviaBosnia and HerzegovinaBotswanaBrazilBrunei DarussalamBurkina FasoBurundiCambodiaCameroonCanadaCaribbean small statesCentral African RepublicCentral Europe and the BalticsChadChileChinaColombiaComorosCongo, Dem. Rep.Congo, Rep.Costa RicaCote d'IvoireCroatiaCubaCyprusCzech RepublicDenmarkDominicaDominican RepublicEarly-demographic dividendEast Asia & PacificEast Asia & Pacific (excluding high income)East Asia & Pacific (IDA & IBRD countries)EcuadorEgypt, Arab Rep.El SalvadorEquatorial GuineaEstoniaEthiopiaEuro areaEurope & Central AsiaEurope & Central Asia (excluding high income)Europe & Central Asia (IDA & IBRD countries)European UnionFaroe IslandsFijiFinlandFragile and conflict affected situationsFranceGabonGambia, TheGeorgiaGermanyGhanaGreeceGrenadaGuatemalaGuineaGuyanaHeavily indebted poor countries (HIPC)High incomeHondurasHong Kong SAR, ChinaHungaryIBRD onlyIcelandIDA & IBRD totalIDA blendIDA onlyIDA totalIndiaIndonesiaIran, Islamic Rep.IraqIrelandItalyJamaicaJapanJordanKazakhstanKenyaKiribatiKorea, Rep.KosovoKuwaitKyrgyz RepublicLao PDRLate-demographic dividendLatin America & Caribbean Latin America & Caribbean (excluding high income)Latin America & the Caribbean (IDA & IBRD countries)LatviaLeast developed countries: UN classificationLebanonLesothoLiberiaLithuaniaLow & middle incomeLow incomeLower middle incomeLuxembourgMacao SAR, ChinaMacedonia, FYRMalawiMalaysiaMaldivesMaltaMarshall IslandsMauritaniaMauritiusMexicoMicronesia, Fed. Sts.Middle East & North AfricaMiddle East & North Africa (excluding high income)Middle East & North Africa (IDA & IBRD countries)Middle incomeMoldovaMongoliaMontenegroMoroccoMozambiqueMyanmarNamibiaNepalNetherlandsNew ZealandNicaraguaNigerNigeriaNorth AmericaNorwayOECD membersOmanOther small statesPacific island small statesPakistanPalauPanamaParaguayPeruPhilippinesPolandPortugalPost-demographic dividendPre-demographic dividendPuerto RicoQatarRomaniaRussian FederationRwandaSamoaSao Tome and PrincipeSaudi ArabiaSenegalSerbiaSeychellesSierra LeoneSingaporeSlovak RepublicSloveniaSmall statesSouth AfricaSouth AsiaSouth Asia (IDA & IBRD)SpainSri LankaSt. Kitts and NevisSt. LuciaSt. Vincent and the GrenadinesSub-Saharan Africa Sub-Saharan Africa (excluding high income)Sub-Saharan Africa (IDA & IBRD countries)SudanSurinameSwazilandSwedenSwitzerlandTajikistanTanzaniaThailandTimor-LesteTogoTongaTrinidad and TobagoTunisiaTurkeyTuvaluUgandaUkraineUnited Arab EmiratesUnited KingdomUnited StatesUpper middle incomeUruguayUzbekistanVanuatuVenezuela, RBVietnamWest Bank and GazaWorldYemen, Rep.ZambiaZimbabwe Timeline:
This timeline shows a graph from 1992 to 2016 of European Union. No data until 1991. Number of actual observations by date: 25.
Source name:
World Development Indicators
Source organization:
World Bank national accounts data, and OECD National Accounts data files.
Categories, topics:
Economy & Growth
Last updated:
apr 23, 2017
Indicators value changes by year
Minimum:
1.731 trl
jan 1, 1994
Maximum:
2.564 trl
jan 1, 2016
At the date of observation
Value
Absolute change
Change from previous value
jan 1, 1992
1.82 trl
+1.82 trl
0.0%
jan 1, 1993
1.798 trl
-21.545 bln
-1.18%
jan 1, 1994
1.731 trl
-67.194 bln
-3.74%
jan 1, 1995
1.816 trl
+84.444 bln
4.88%
jan 1, 1996
1.865 trl
+49.088 bln
2.7%
jan 1, 1997
1.868 trl
+2.798 bln
0.15%
jan 1, 1998
1.94 trl
+72.487 bln
3.88%
jan 1, 1999
1.992 trl
+52.083 bln
2.68%
jan 1, 2000
2.039 trl
+47.11 bln
2.36%
jan 1, 2001
2.155 trl
+115.76 bln
5.68%
jan 1, 2002
2.183 trl
+27.782 bln
1.29%
jan 1, 2003
2.179 trl
-3.586 bln
-0.16%
jan 1, 2004
2.2 trl
+21.224 bln
0.97%
jan 1, 2005
2.272 trl
+71.048 bln
3.23%
jan 1, 2006
2.316 trl
+44.079 bln
1.94%
jan 1, 2007
2.447 trl
+131.628 bln
5.68%
jan 1, 2008
2.539 trl
+91.644 bln
3.74%
jan 1, 2009
2.491 trl
-47.528 bln
-1.87%
jan 1, 2010
2.149 trl
-342.475 bln
-13.75%
jan 1, 2011
2.349 trl
+199.767 bln
9.3%
jan 1, 2012
2.451 trl
+102.577 bln
4.37%
jan 1, 2013
2.397 trl
-53.96 bln
-2.2%
jan 1, 2014
2.388 trl
-9.459 bln
-0.39%
jan 1, 2015
2.463 trl
+75.243 bln
3.15%
jan 1, 2016
2.564 trl
+101.063 bln
4.1%
Ranking of countries by current statistics by years


Comments: