29
/
en
AIzaSyAYiBZKx7MnpbEhh9jyipgxe19OcubqV5w
April 1, 2024
167755
Kenya
KEN
true
2
1
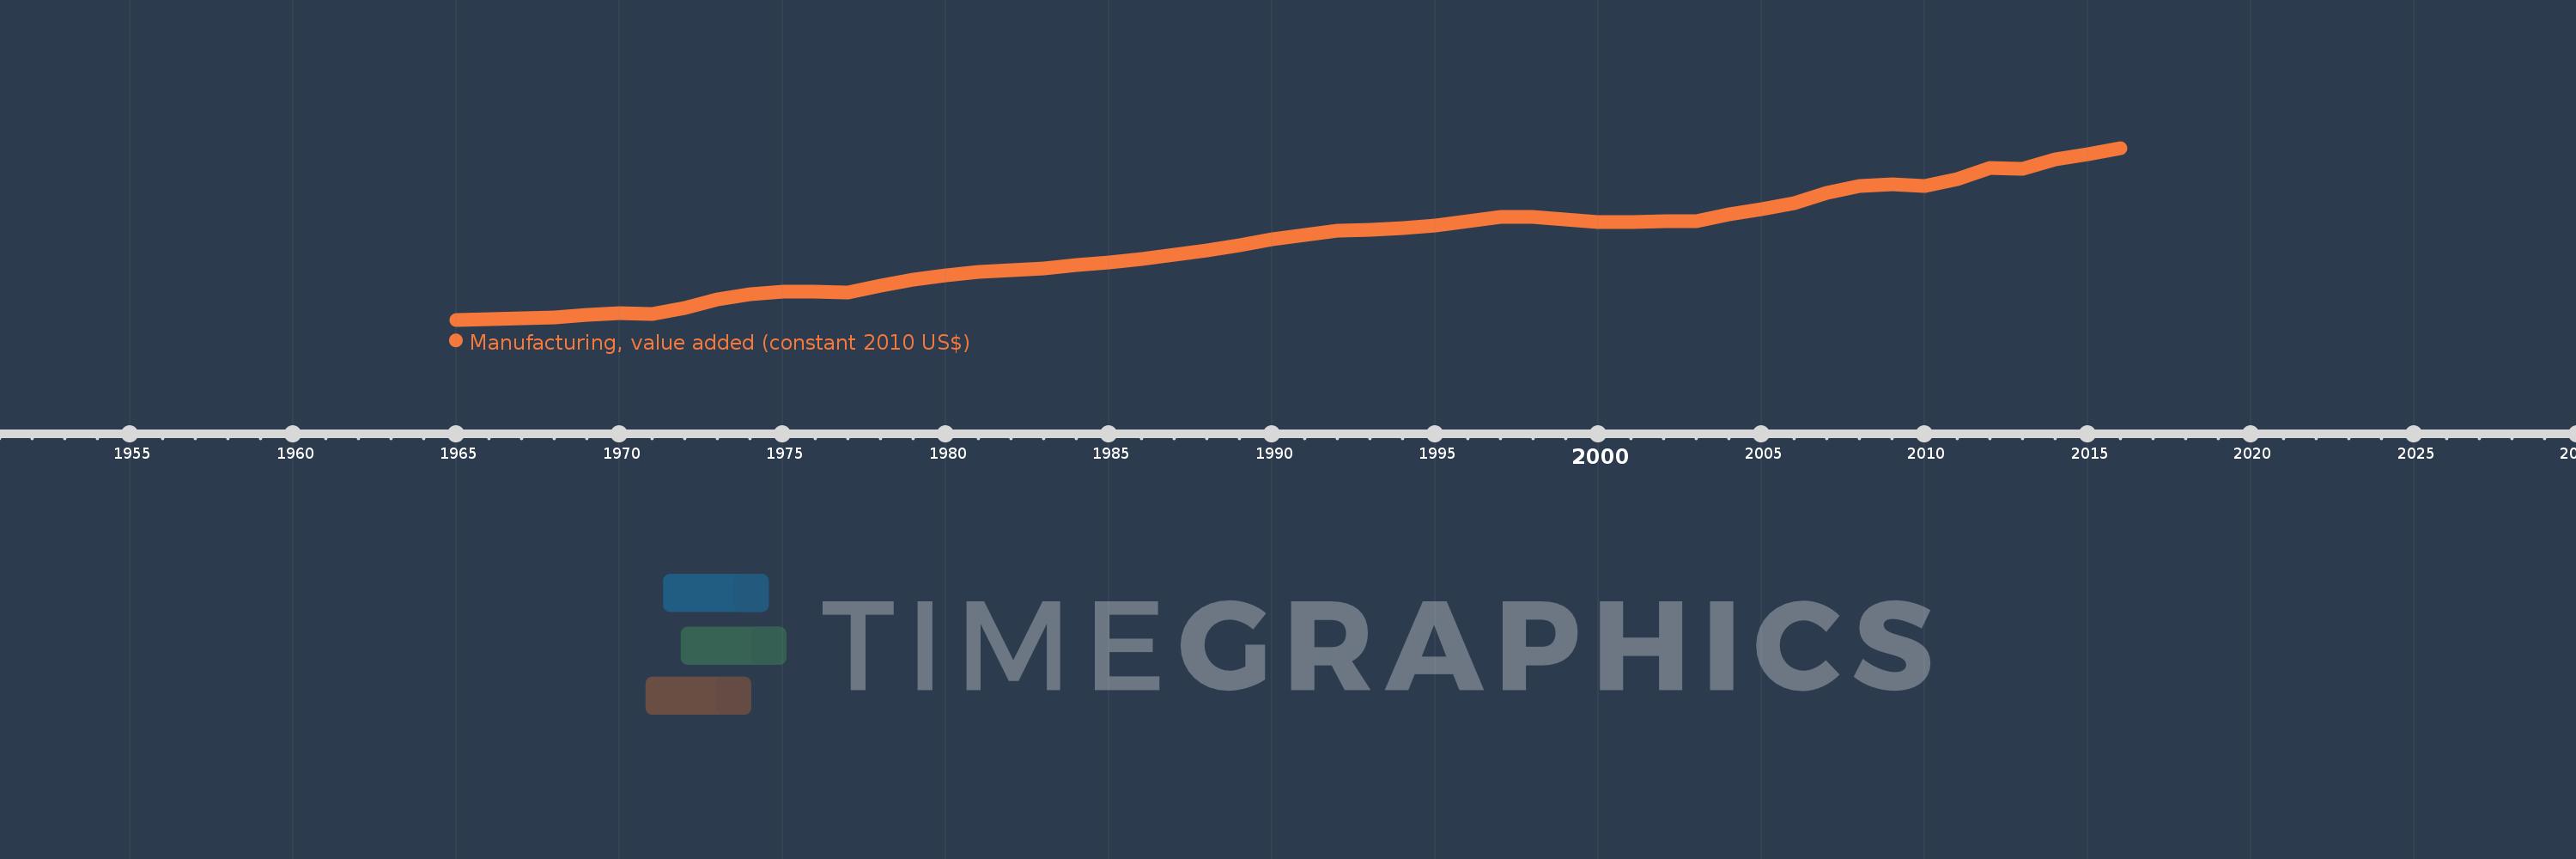
Manufacturing, value added (constant 2010 US$)
2016,2015,2014,2013,2012,2011,2010,2009,2008,2007,2006,2005,2004,2003,2002,2001,2000,1999,1998,1997,1996,1995,1994,1993,1992,1991,1990,1989,1988,1987,1986,1985,1984,1983,1982,1981,1980,1979,1978,1977,1976,1975,1974,1973,1972,1971,1970,1969,1968,1967,1966,1965
This statistics in other country:
AfghanistanAlbaniaAndorraAntigua and BarbudaArab WorldArgentinaArmeniaArubaAustraliaAustriaAzerbaijanBahamas, TheBahrainBangladeshBarbadosBelarusBelgiumBelizeBeninBermudaBhutanBoliviaBosnia and HerzegovinaBotswanaBrazilBrunei DarussalamBurkina FasoBurundiCambodiaCameroonCanadaCaribbean small statesCentral African RepublicCentral Europe and the BalticsChadChileChinaColombiaComorosCongo, Dem. Rep.Congo, Rep.Costa RicaCote d'IvoireCroatiaCubaCyprusCzech RepublicDenmarkDominicaDominican RepublicEarly-demographic dividendEast Asia & PacificEast Asia & Pacific (excluding high income)East Asia & Pacific (IDA & IBRD countries)EcuadorEgypt, Arab Rep.El SalvadorEquatorial GuineaEstoniaEthiopiaEuro areaEurope & Central AsiaEurope & Central Asia (excluding high income)Europe & Central Asia (IDA & IBRD countries)European UnionFaroe IslandsFijiFinlandFragile and conflict affected situationsFranceGabonGambia, TheGeorgiaGermanyGhanaGreeceGrenadaGuatemalaGuineaGuyanaHeavily indebted poor countries (HIPC)High incomeHondurasHong Kong SAR, ChinaHungaryIBRD onlyIcelandIDA & IBRD totalIDA blendIDA onlyIDA totalIndiaIndonesiaIran, Islamic Rep.IraqIrelandItalyJamaicaJapanJordanKazakhstanKenyaKiribatiKorea, Rep.KosovoKuwaitKyrgyz RepublicLao PDRLate-demographic dividendLatin America & Caribbean Latin America & Caribbean (excluding high income)Latin America & the Caribbean (IDA & IBRD countries)LatviaLeast developed countries: UN classificationLebanonLesothoLiberiaLithuaniaLow & middle incomeLow incomeLower middle incomeLuxembourgMacao SAR, ChinaMacedonia, FYRMalawiMalaysiaMaldivesMaltaMarshall IslandsMauritaniaMauritiusMexicoMicronesia, Fed. Sts.Middle East & North AfricaMiddle East & North Africa (excluding high income)Middle East & North Africa (IDA & IBRD countries)Middle incomeMoldovaMongoliaMontenegroMoroccoMozambiqueMyanmarNamibiaNepalNetherlandsNew ZealandNicaraguaNigerNigeriaNorth AmericaNorwayOECD membersOmanOther small statesPacific island small statesPakistanPalauPanamaParaguayPeruPhilippinesPolandPortugalPost-demographic dividendPre-demographic dividendPuerto RicoQatarRomaniaRussian FederationRwandaSamoaSao Tome and PrincipeSaudi ArabiaSenegalSerbiaSeychellesSierra LeoneSingaporeSlovak RepublicSloveniaSmall statesSouth AfricaSouth AsiaSouth Asia (IDA & IBRD)SpainSri LankaSt. Kitts and NevisSt. LuciaSt. Vincent and the GrenadinesSub-Saharan Africa Sub-Saharan Africa (excluding high income)Sub-Saharan Africa (IDA & IBRD countries)SudanSurinameSwazilandSwedenSwitzerlandTajikistanTanzaniaThailandTimor-LesteTogoTongaTrinidad and TobagoTunisiaTurkeyTuvaluUgandaUkraineUnited Arab EmiratesUnited KingdomUnited StatesUpper middle incomeUruguayUzbekistanVanuatuVenezuela, RBVietnamWest Bank and GazaWorldYemen, Rep.ZambiaZimbabwe Timeline:
This timeline shows a graph from 1965 to 2016 of Kenya. No data until 1964. Number of actual observations by date: 52.
Source name:
World Development Indicators
Source organization:
World Bank national accounts data, and OECD National Accounts data files.
Categories, topics:
Economy & Growth
Last updated:
apr 23, 2017
Indicators value changes by year
Minimum:
437.608 mln
jan 1, 1965
Maximum:
5.414 bln
jan 1, 2016
At the date of observation
Value
Absolute change
Change from previous value
jan 1, 1965
437.608 mln
+437.608 mln
0.0%
jan 1, 1966
457.209 mln
+19.602 mln
4.48%
jan 1, 1967
485.46 mln
+28.25 mln
6.18%
jan 1, 1968
504.181 mln
+18.721 mln
3.86%
jan 1, 1969
570.703 mln
+66.522 mln
13.19%
jan 1, 1970
629.326 mln
+58.624 mln
10.27%
jan 1, 1971
602.138 mln
-27.189 mln
-4.32%
jan 1, 1972
779.537 mln
+177.399 mln
29.46%
jan 1, 1973
1.036 bln
+256.221 mln
32.87%
jan 1, 1974
1.179 bln
+143.142 mln
13.82%
jan 1, 1975
1.241 bln
+61.757 mln
5.24%
jan 1, 1976
1.248 bln
+7.432 mln
0.6%
jan 1, 1977
1.234 bln
-13.594 mln
-1.09%
jan 1, 1978
1.431 bln
+196.224 mln
15.9%
jan 1, 1979
1.61 bln
+178.953 mln
12.51%
jan 1, 1980
1.73 bln
+120.044 mln
7.46%
jan 1, 1981
1.82 bln
+90.63 mln
5.24%
jan 1, 1982
1.886 bln
+65.252 mln
3.58%
jan 1, 1983
1.928 bln
+42.466 mln
2.25%
jan 1, 1984
2.015 bln
+86.849 mln
4.5%
jan 1, 1985
2.102 bln
+86.849 mln
4.31%
jan 1, 1986
2.196 bln
+94.409 mln
4.49%
jan 1, 1987
2.324 bln
+127.398 mln
5.8%
jan 1, 1988
2.457 bln
+132.94 mln
5.72%
jan 1, 1989
2.604 bln
+147.389 mln
6.0%
jan 1, 1990
2.758 bln
+153.655 mln
5.9%
jan 1, 1991
2.902 bln
+144.333 mln
5.23%
jan 1, 1992
3.012 bln
+110.256 mln
3.8%
jan 1, 1993
3.048 bln
+36.148 mln
1.2%
jan 1, 1994
3.103 bln
+54.895 mln
1.8%
jan 1, 1995
3.162 bln
+58.935 mln
1.9%
jan 1, 1996
3.285 bln
+123.307 mln
3.9%
jan 1, 1997
3.406 bln
+120.51 mln
3.67%
jan 1, 1998
3.405 bln
-1.384 mln
-0.04%
jan 1, 1999
3.333 bln
-72.014 mln
-2.12%
jan 1, 2000
3.255 bln
-77.318 mln
-2.32%
jan 1, 2001
3.277 bln
+22.138 mln
0.68%
jan 1, 2002
3.287 bln
+9.619 mln
0.29%
jan 1, 2003
3.29 bln
+2.668 mln
0.08%
jan 1, 2004
3.486 bln
+196.473 mln
5.97%
jan 1, 2005
3.642 bln
+155.558 mln
4.46%
jan 1, 2006
3.811 bln
+169.789 mln
4.66%
jan 1, 2007
4.124 bln
+312.853 mln
8.21%
jan 1, 2008
4.305 bln
+180.471 mln
4.38%
jan 1, 2009
4.354 bln
+49.177 mln
1.14%
jan 1, 2010
4.308 bln
-45.844 mln
-1.05%
jan 1, 2011
4.502 bln
+194.005 mln
4.5%
jan 1, 2012
4.828 bln
+326.167 mln
7.24%
jan 1, 2013
4.801 bln
-26.915 mln
-0.56%
jan 1, 2014
5.07 bln
+268.915 mln
5.6%
jan 1, 2015
5.233 bln
+162.222 mln
3.2%
jan 1, 2016
5.414 bln
+181.012 mln
3.46%
Ranking of countries by current statistics by years


Comments: