29
/
en
AIzaSyAYiBZKx7MnpbEhh9jyipgxe19OcubqV5w
April 1, 2024
111191
Congo, Rep.
COG
true
2
1
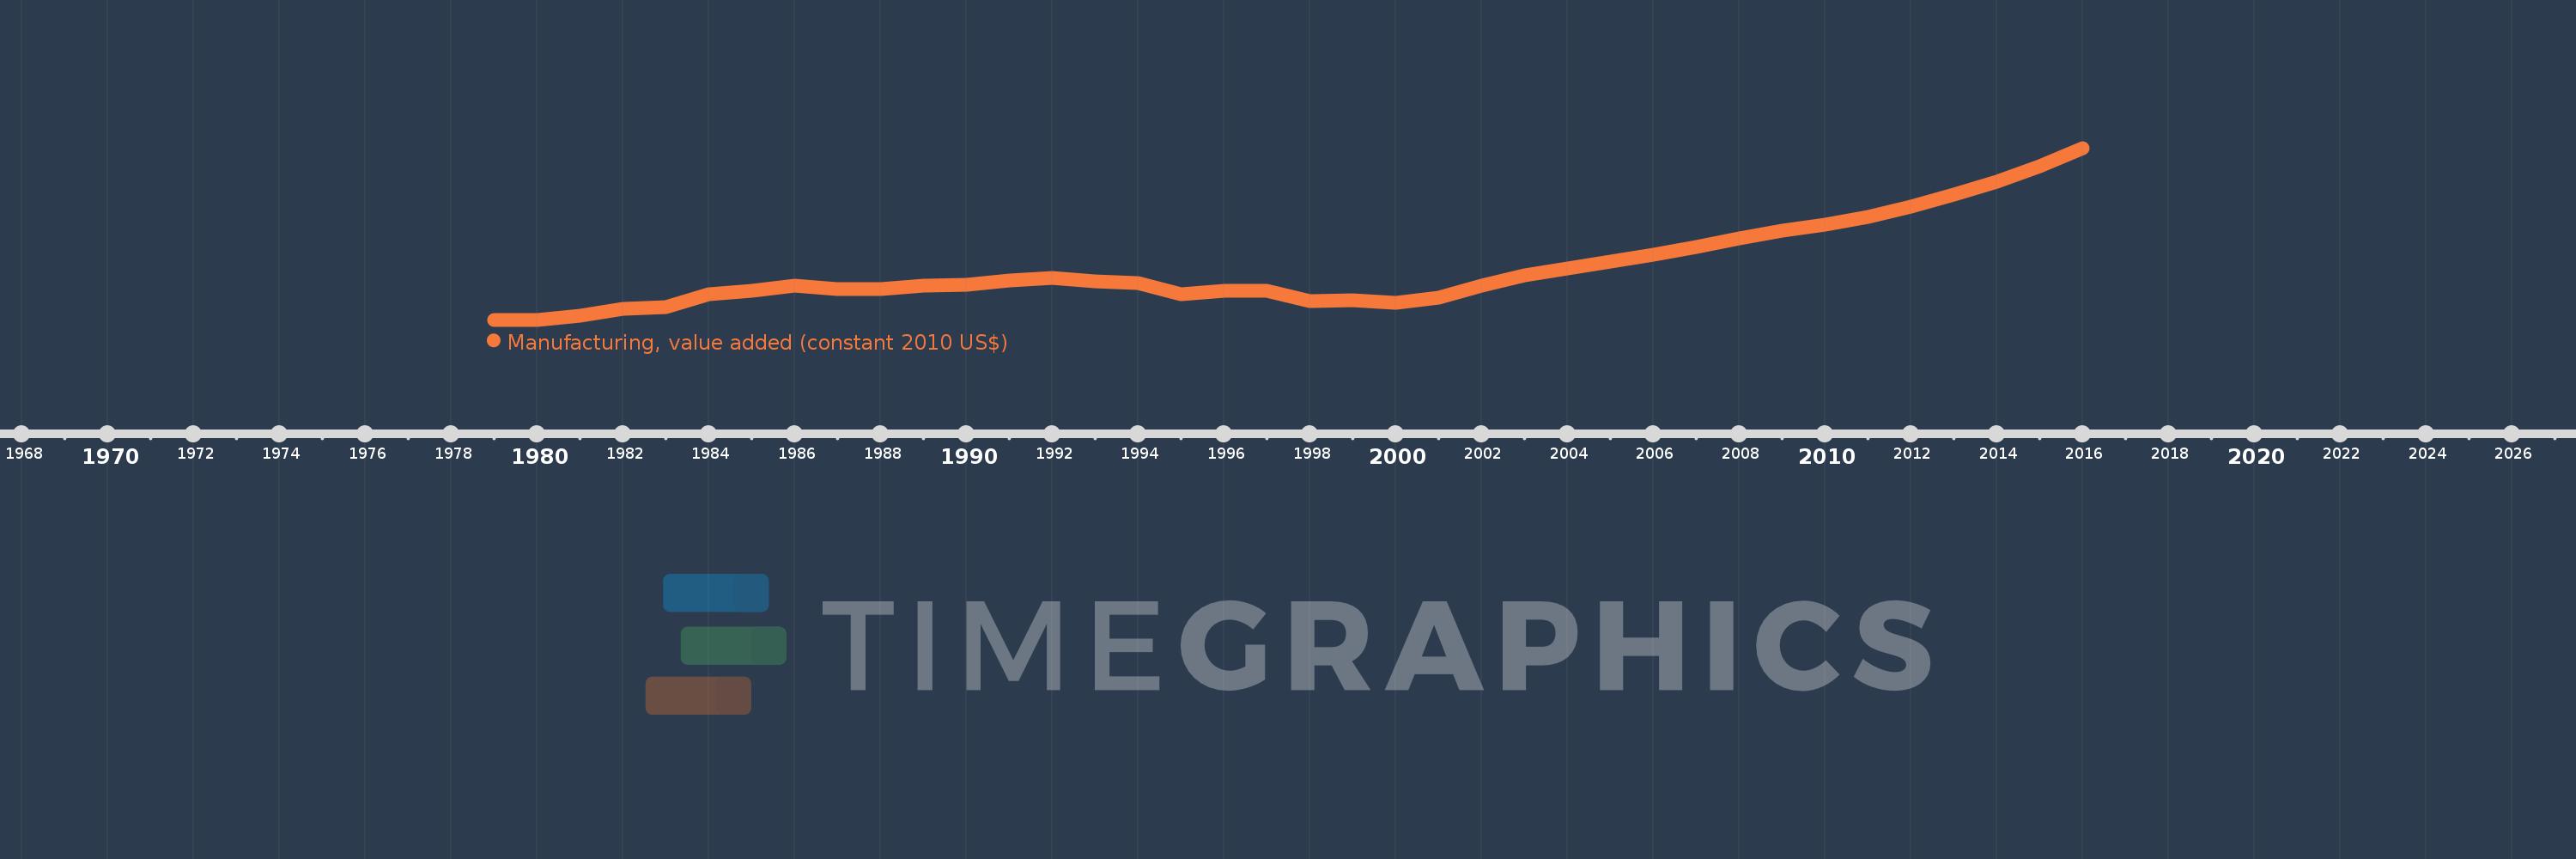
Manufacturing, value added (constant 2010 US$)
2016,2015,2014,2013,2012,2011,2010,2009,2008,2007,2006,2005,2004,2003,2002,2001,2000,1999,1998,1997,1996,1995,1994,1993,1992,1991,1990,1989,1988,1987,1986,1985,1984,1983,1982,1981,1980,1979
This statistics in other country:
AfghanistanAlbaniaAndorraAntigua and BarbudaArab WorldArgentinaArmeniaArubaAustraliaAustriaAzerbaijanBahamas, TheBahrainBangladeshBarbadosBelarusBelgiumBelizeBeninBermudaBhutanBoliviaBosnia and HerzegovinaBotswanaBrazilBrunei DarussalamBurkina FasoBurundiCambodiaCameroonCanadaCaribbean small statesCentral African RepublicCentral Europe and the BalticsChadChileChinaColombiaComorosCongo, Dem. Rep.Congo, Rep.Costa RicaCote d'IvoireCroatiaCubaCyprusCzech RepublicDenmarkDominicaDominican RepublicEarly-demographic dividendEast Asia & PacificEast Asia & Pacific (excluding high income)East Asia & Pacific (IDA & IBRD countries)EcuadorEgypt, Arab Rep.El SalvadorEquatorial GuineaEstoniaEthiopiaEuro areaEurope & Central AsiaEurope & Central Asia (excluding high income)Europe & Central Asia (IDA & IBRD countries)European UnionFaroe IslandsFijiFinlandFragile and conflict affected situationsFranceGabonGambia, TheGeorgiaGermanyGhanaGreeceGrenadaGuatemalaGuineaGuyanaHeavily indebted poor countries (HIPC)High incomeHondurasHong Kong SAR, ChinaHungaryIBRD onlyIcelandIDA & IBRD totalIDA blendIDA onlyIDA totalIndiaIndonesiaIran, Islamic Rep.IraqIrelandItalyJamaicaJapanJordanKazakhstanKenyaKiribatiKorea, Rep.KosovoKuwaitKyrgyz RepublicLao PDRLate-demographic dividendLatin America & Caribbean Latin America & Caribbean (excluding high income)Latin America & the Caribbean (IDA & IBRD countries)LatviaLeast developed countries: UN classificationLebanonLesothoLiberiaLithuaniaLow & middle incomeLow incomeLower middle incomeLuxembourgMacao SAR, ChinaMacedonia, FYRMalawiMalaysiaMaldivesMaltaMarshall IslandsMauritaniaMauritiusMexicoMicronesia, Fed. Sts.Middle East & North AfricaMiddle East & North Africa (excluding high income)Middle East & North Africa (IDA & IBRD countries)Middle incomeMoldovaMongoliaMontenegroMoroccoMozambiqueMyanmarNamibiaNepalNetherlandsNew ZealandNicaraguaNigerNigeriaNorth AmericaNorwayOECD membersOmanOther small statesPacific island small statesPakistanPalauPanamaParaguayPeruPhilippinesPolandPortugalPost-demographic dividendPre-demographic dividendPuerto RicoQatarRomaniaRussian FederationRwandaSamoaSao Tome and PrincipeSaudi ArabiaSenegalSerbiaSeychellesSierra LeoneSingaporeSlovak RepublicSloveniaSmall statesSouth AfricaSouth AsiaSouth Asia (IDA & IBRD)SpainSri LankaSt. Kitts and NevisSt. LuciaSt. Vincent and the GrenadinesSub-Saharan Africa Sub-Saharan Africa (excluding high income)Sub-Saharan Africa (IDA & IBRD countries)SudanSurinameSwazilandSwedenSwitzerlandTajikistanTanzaniaThailandTimor-LesteTogoTongaTrinidad and TobagoTunisiaTurkeyTuvaluUgandaUkraineUnited Arab EmiratesUnited KingdomUnited StatesUpper middle incomeUruguayUzbekistanVanuatuVenezuela, RBVietnamWest Bank and GazaWorldYemen, Rep.ZambiaZimbabwe Timeline:
This timeline shows a graph from 1979 to 2016 of Congo, Rep.. No data until 1978. Number of actual observations by date: 38.
Source name:
World Development Indicators
Source organization:
World Bank national accounts data, and OECD National Accounts data files.
Categories, topics:
Economy & Growth
Last updated:
apr 23, 2017
Indicators value changes by year
Minimum:
94.229 mln
jan 1, 1979
Maximum:
697.913 mln
jan 1, 2016
At the date of observation
Value
Absolute change
Change from previous value
jan 1, 1979
94.229 mln
+94.229 mln
0.0%
jan 1, 1980
94.229 mln
0.0
0.0%
jan 1, 1981
109.51 mln
+15.28 mln
16.22%
jan 1, 1982
131.212 mln
+21.702 mln
19.82%
jan 1, 1983
139.824 mln
+8.612 mln
6.56%
jan 1, 1984
183.899 mln
+44.075 mln
31.52%
jan 1, 1985
195.044 mln
+11.145 mln
6.06%
jan 1, 1986
213.789 mln
+18.745 mln
9.61%
jan 1, 1987
200.617 mln
-13.172 mln
-6.16%
jan 1, 1988
202.051 mln
+1.434 mln
0.71%
jan 1, 1989
215.162 mln
+13.111 mln
6.49%
jan 1, 1990
217.842 mln
+2.68 mln
1.25%
jan 1, 1991
231.404 mln
+13.563 mln
6.23%
jan 1, 1992
239.735 mln
+8.331 mln
3.6%
jan 1, 1993
227.748 mln
-11.987 mln
-5.0%
jan 1, 1994
223.649 mln
-4.099 mln
-1.8%
jan 1, 1995
184.51 mln
-39.139 mln
-17.5%
jan 1, 1996
194.656 mln
+10.146 mln
5.5%
jan 1, 1997
196.408 mln
+1.752 mln
0.9%
jan 1, 1998
159.582 mln
-36.827 mln
-18.75%
jan 1, 1999
162.831 mln
+3.249 mln
2.04%
jan 1, 2000
152.814 mln
-10.017 mln
-6.15%
jan 1, 2001
173.044 mln
+20.23 mln
13.24%
jan 1, 2002
213.94 mln
+40.896 mln
23.63%
jan 1, 2003
250.324 mln
+36.384 mln
17.01%
jan 1, 2004
275.43 mln
+25.105 mln
10.03%
jan 1, 2005
298.716 mln
+23.286 mln
8.45%
jan 1, 2006
323.093 mln
+24.378 mln
8.16%
jan 1, 2007
348.926 mln
+25.833 mln
8.0%
jan 1, 2008
380.329 mln
+31.403 mln
9.0%
jan 1, 2009
406.952 mln
+26.623 mln
7.0%
jan 1, 2010
429.335 mln
+22.382 mln
5.5%
jan 1, 2011
454.236 mln
+24.901 mln
5.8%
jan 1, 2012
490.575 mln
+36.339 mln
8.0%
jan 1, 2013
533.255 mln
+42.68 mln
8.7%
jan 1, 2014
580.715 mln
+47.46 mln
8.9%
jan 1, 2015
632.708 mln
+51.994 mln
8.95%
jan 1, 2016
697.913 mln
+65.205 mln
10.31%
Ranking of countries by current statistics by years


Comments: