29
/
en
AIzaSyAYiBZKx7MnpbEhh9jyipgxe19OcubqV5w
April 1, 2024
195826
Mexico
MEX
true
2
1
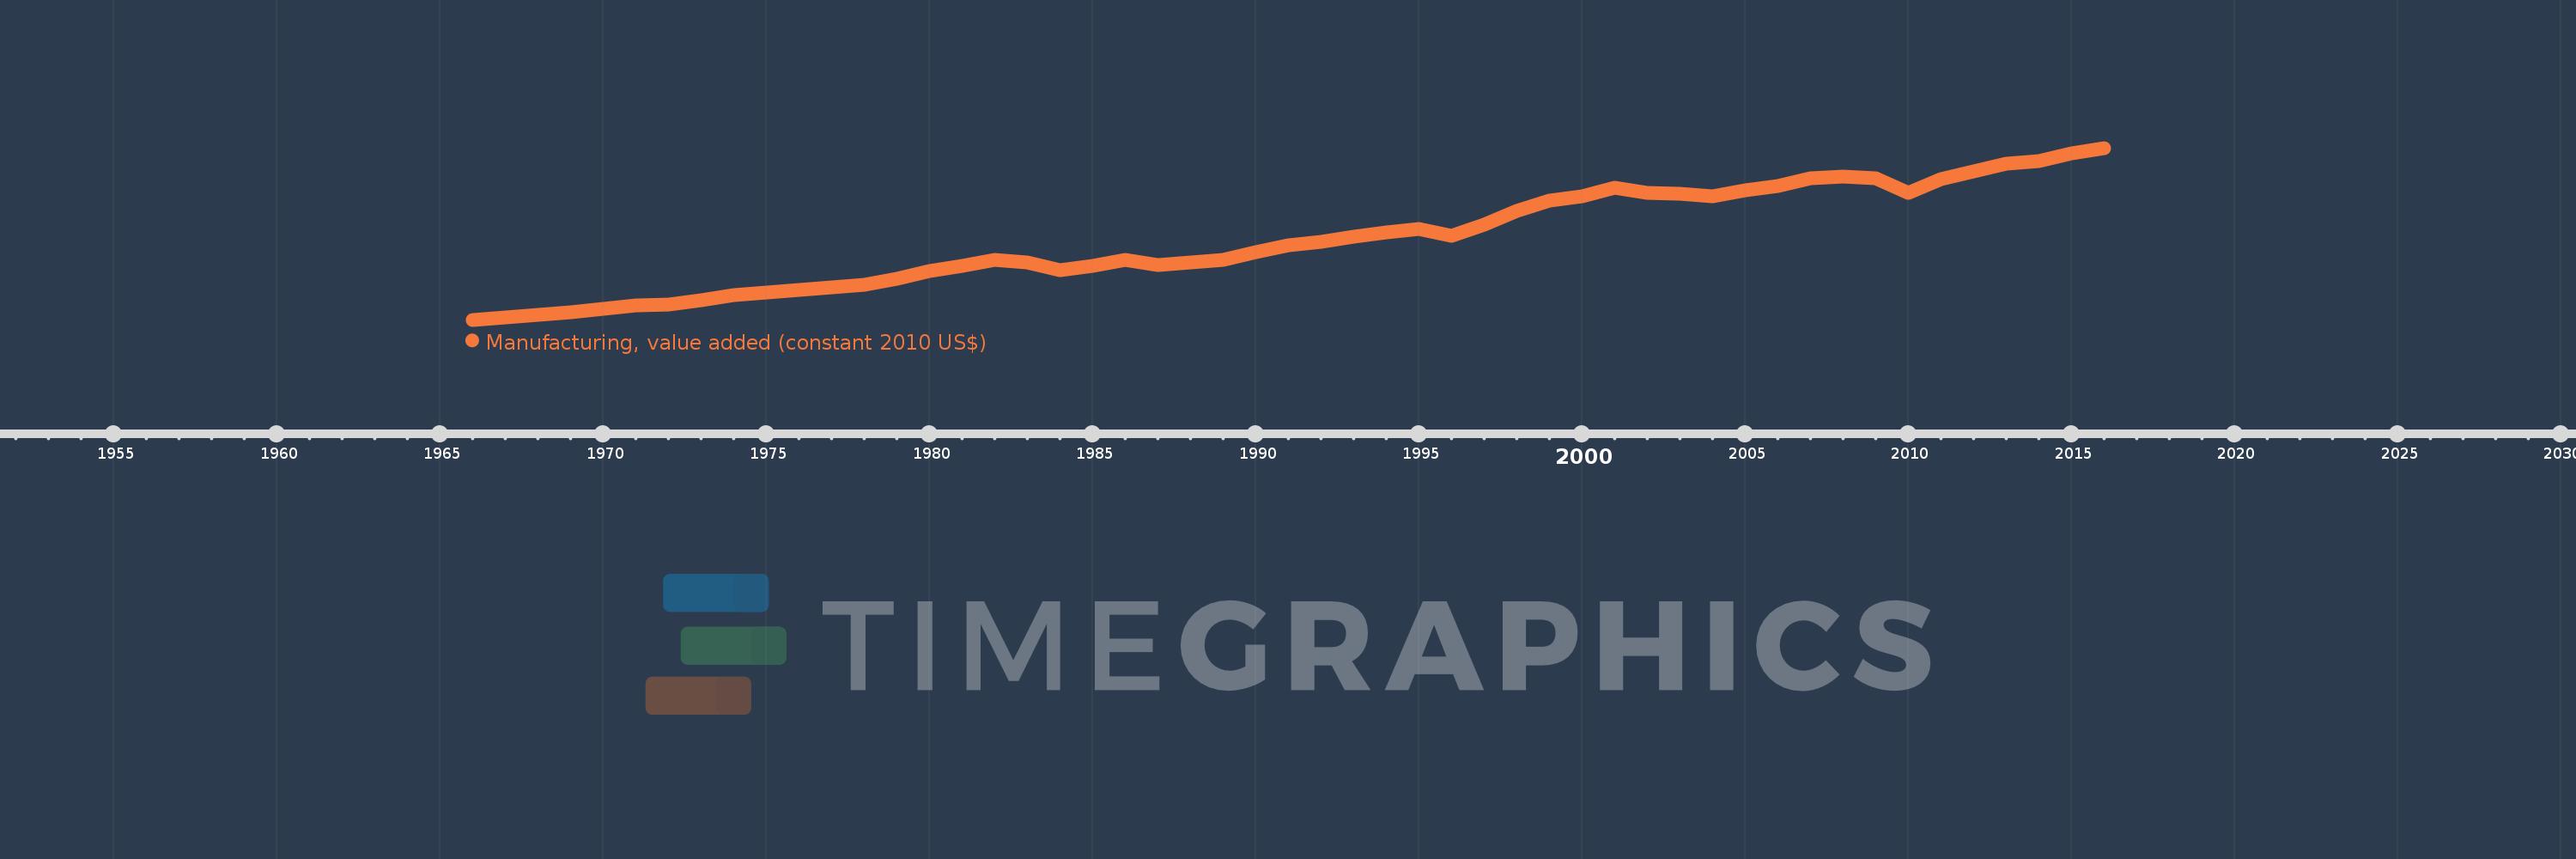
Manufacturing, value added (constant 2010 US$)
2016,2015,2014,2013,2012,2011,2010,2009,2008,2007,2006,2005,2004,2003,2002,2001,2000,1999,1998,1997,1996,1995,1994,1993,1992,1991,1990,1989,1988,1987,1986,1985,1984,1983,1982,1981,1980,1979,1978,1977,1976,1975,1974,1973,1972,1971,1970,1969,1968,1967,1966
This statistics in other country:
AfghanistanAlbaniaAndorraAntigua and BarbudaArab WorldArgentinaArmeniaArubaAustraliaAustriaAzerbaijanBahamas, TheBahrainBangladeshBarbadosBelarusBelgiumBelizeBeninBermudaBhutanBoliviaBosnia and HerzegovinaBotswanaBrazilBrunei DarussalamBurkina FasoBurundiCambodiaCameroonCanadaCaribbean small statesCentral African RepublicCentral Europe and the BalticsChadChileChinaColombiaComorosCongo, Dem. Rep.Congo, Rep.Costa RicaCote d'IvoireCroatiaCubaCyprusCzech RepublicDenmarkDominicaDominican RepublicEarly-demographic dividendEast Asia & PacificEast Asia & Pacific (excluding high income)East Asia & Pacific (IDA & IBRD countries)EcuadorEgypt, Arab Rep.El SalvadorEquatorial GuineaEstoniaEthiopiaEuro areaEurope & Central AsiaEurope & Central Asia (excluding high income)Europe & Central Asia (IDA & IBRD countries)European UnionFaroe IslandsFijiFinlandFragile and conflict affected situationsFranceGabonGambia, TheGeorgiaGermanyGhanaGreeceGrenadaGuatemalaGuineaGuyanaHeavily indebted poor countries (HIPC)High incomeHondurasHong Kong SAR, ChinaHungaryIBRD onlyIcelandIDA & IBRD totalIDA blendIDA onlyIDA totalIndiaIndonesiaIran, Islamic Rep.IraqIrelandItalyJamaicaJapanJordanKazakhstanKenyaKiribatiKorea, Rep.KosovoKuwaitKyrgyz RepublicLao PDRLate-demographic dividendLatin America & Caribbean Latin America & Caribbean (excluding high income)Latin America & the Caribbean (IDA & IBRD countries)LatviaLeast developed countries: UN classificationLebanonLesothoLiberiaLithuaniaLow & middle incomeLow incomeLower middle incomeLuxembourgMacao SAR, ChinaMacedonia, FYRMalawiMalaysiaMaldivesMaltaMarshall IslandsMauritaniaMauritiusMexicoMicronesia, Fed. Sts.Middle East & North AfricaMiddle East & North Africa (excluding high income)Middle East & North Africa (IDA & IBRD countries)Middle incomeMoldovaMongoliaMontenegroMoroccoMozambiqueMyanmarNamibiaNepalNetherlandsNew ZealandNicaraguaNigerNigeriaNorth AmericaNorwayOECD membersOmanOther small statesPacific island small statesPakistanPalauPanamaParaguayPeruPhilippinesPolandPortugalPost-demographic dividendPre-demographic dividendPuerto RicoQatarRomaniaRussian FederationRwandaSamoaSao Tome and PrincipeSaudi ArabiaSenegalSerbiaSeychellesSierra LeoneSingaporeSlovak RepublicSloveniaSmall statesSouth AfricaSouth AsiaSouth Asia (IDA & IBRD)SpainSri LankaSt. Kitts and NevisSt. LuciaSt. Vincent and the GrenadinesSub-Saharan Africa Sub-Saharan Africa (excluding high income)Sub-Saharan Africa (IDA & IBRD countries)SudanSurinameSwazilandSwedenSwitzerlandTajikistanTanzaniaThailandTimor-LesteTogoTongaTrinidad and TobagoTunisiaTurkeyTuvaluUgandaUkraineUnited Arab EmiratesUnited KingdomUnited StatesUpper middle incomeUruguayUzbekistanVanuatuVenezuela, RBVietnamWest Bank and GazaWorldYemen, Rep.ZambiaZimbabwe Timeline:
This timeline shows a graph from 1966 to 2016 of Mexico. No data until 1965. Number of actual observations by date: 51.
Source name:
World Development Indicators
Source organization:
World Bank national accounts data, and OECD National Accounts data files.
Categories, topics:
Economy & Growth
Last updated:
apr 23, 2017
Indicators value changes by year
Minimum:
33.901 bln
jan 1, 1966
Maximum:
205.315 bln
jan 1, 2016
At the date of observation
Value
Absolute change
Change from previous value
jan 1, 1966
33.901 bln
+33.901 bln
0.0%
jan 1, 1967
36.415 bln
+2.514 bln
7.42%
jan 1, 1968
38.559 bln
+2.143 bln
5.89%
jan 1, 1969
41.616 bln
+3.057 bln
7.93%
jan 1, 1970
44.546 bln
+2.93 bln
7.04%
jan 1, 1971
47.811 bln
+3.266 bln
7.33%
jan 1, 1972
49.189 bln
+1.378 bln
2.88%
jan 1, 1973
53.424 bln
+4.235 bln
8.61%
jan 1, 1974
58.269 bln
+4.845 bln
9.07%
jan 1, 1975
61.213 bln
+2.945 bln
5.05%
jan 1, 1976
63.757 bln
+2.544 bln
4.16%
jan 1, 1977
66.579 bln
+2.823 bln
4.43%
jan 1, 1978
68.51 bln
+1.931 bln
2.9%
jan 1, 1979
75.195 bln
+6.685 bln
9.76%
jan 1, 1980
82.878 bln
+7.683 bln
10.22%
jan 1, 1981
87.699 bln
+4.82 bln
5.82%
jan 1, 1982
93.353 bln
+5.654 bln
6.45%
jan 1, 1983
90.795 bln
-2.558 bln
-2.74%
jan 1, 1984
83.677 bln
-7.118 bln
-7.84%
jan 1, 1985
87.872 bln
+4.195 bln
5.01%
jan 1, 1986
93.216 bln
+5.343 bln
6.08%
jan 1, 1987
88.315 bln
-4.901 bln
-5.26%
jan 1, 1988
91.001 bln
+2.686 bln
3.04%
jan 1, 1989
93.912 bln
+2.911 bln
3.2%
jan 1, 1990
101.326 bln
+7.414 bln
7.89%
jan 1, 1991
108.181 bln
+6.855 bln
6.77%
jan 1, 1992
111.894 bln
+3.713 bln
3.43%
jan 1, 1993
116.552 bln
+4.658 bln
4.16%
jan 1, 1994
120.751 bln
+4.199 bln
3.6%
jan 1, 1995
124.542 bln
+3.791 bln
3.14%
jan 1, 1996
118.044 bln
-6.498 bln
-5.22%
jan 1, 1997
129.045 bln
+11.001 bln
9.32%
jan 1, 1998
142.591 bln
+13.546 bln
10.5%
jan 1, 1999
152.691 bln
+10.1 bln
7.08%
jan 1, 2000
156.829 bln
+4.139 bln
2.71%
jan 1, 2001
165.892 bln
+9.063 bln
5.78%
jan 1, 2002
160.723 bln
-5.169 bln
-3.12%
jan 1, 2003
159.642 bln
-1.082 bln
-0.67%
jan 1, 2004
157.466 bln
-2.176 bln
-1.36%
jan 1, 2005
163.085 bln
+5.619 bln
3.57%
jan 1, 2006
167.538 bln
+4.453 bln
2.73%
jan 1, 2007
175.078 bln
+7.54 bln
4.5%
jan 1, 2008
176.755 bln
+1.677 bln
0.96%
jan 1, 2009
174.972 bln
-1.783 bln
-1.01%
jan 1, 2010
160.356 bln
-14.616 bln
-8.35%
jan 1, 2011
174.062 bln
+13.706 bln
8.55%
jan 1, 2012
182.055 bln
+7.993 bln
4.59%
jan 1, 2013
189.545 bln
+7.49 bln
4.11%
jan 1, 2014
191.846 bln
+2.3 bln
1.21%
jan 1, 2015
199.772 bln
+7.926 bln
4.13%
jan 1, 2016
205.315 bln
+5.543 bln
2.77%
Ranking of countries by current statistics by years


Comments: