29
/
en
AIzaSyAYiBZKx7MnpbEhh9jyipgxe19OcubqV5w
April 1, 2024
262520
Thailand
THA
true
2
1
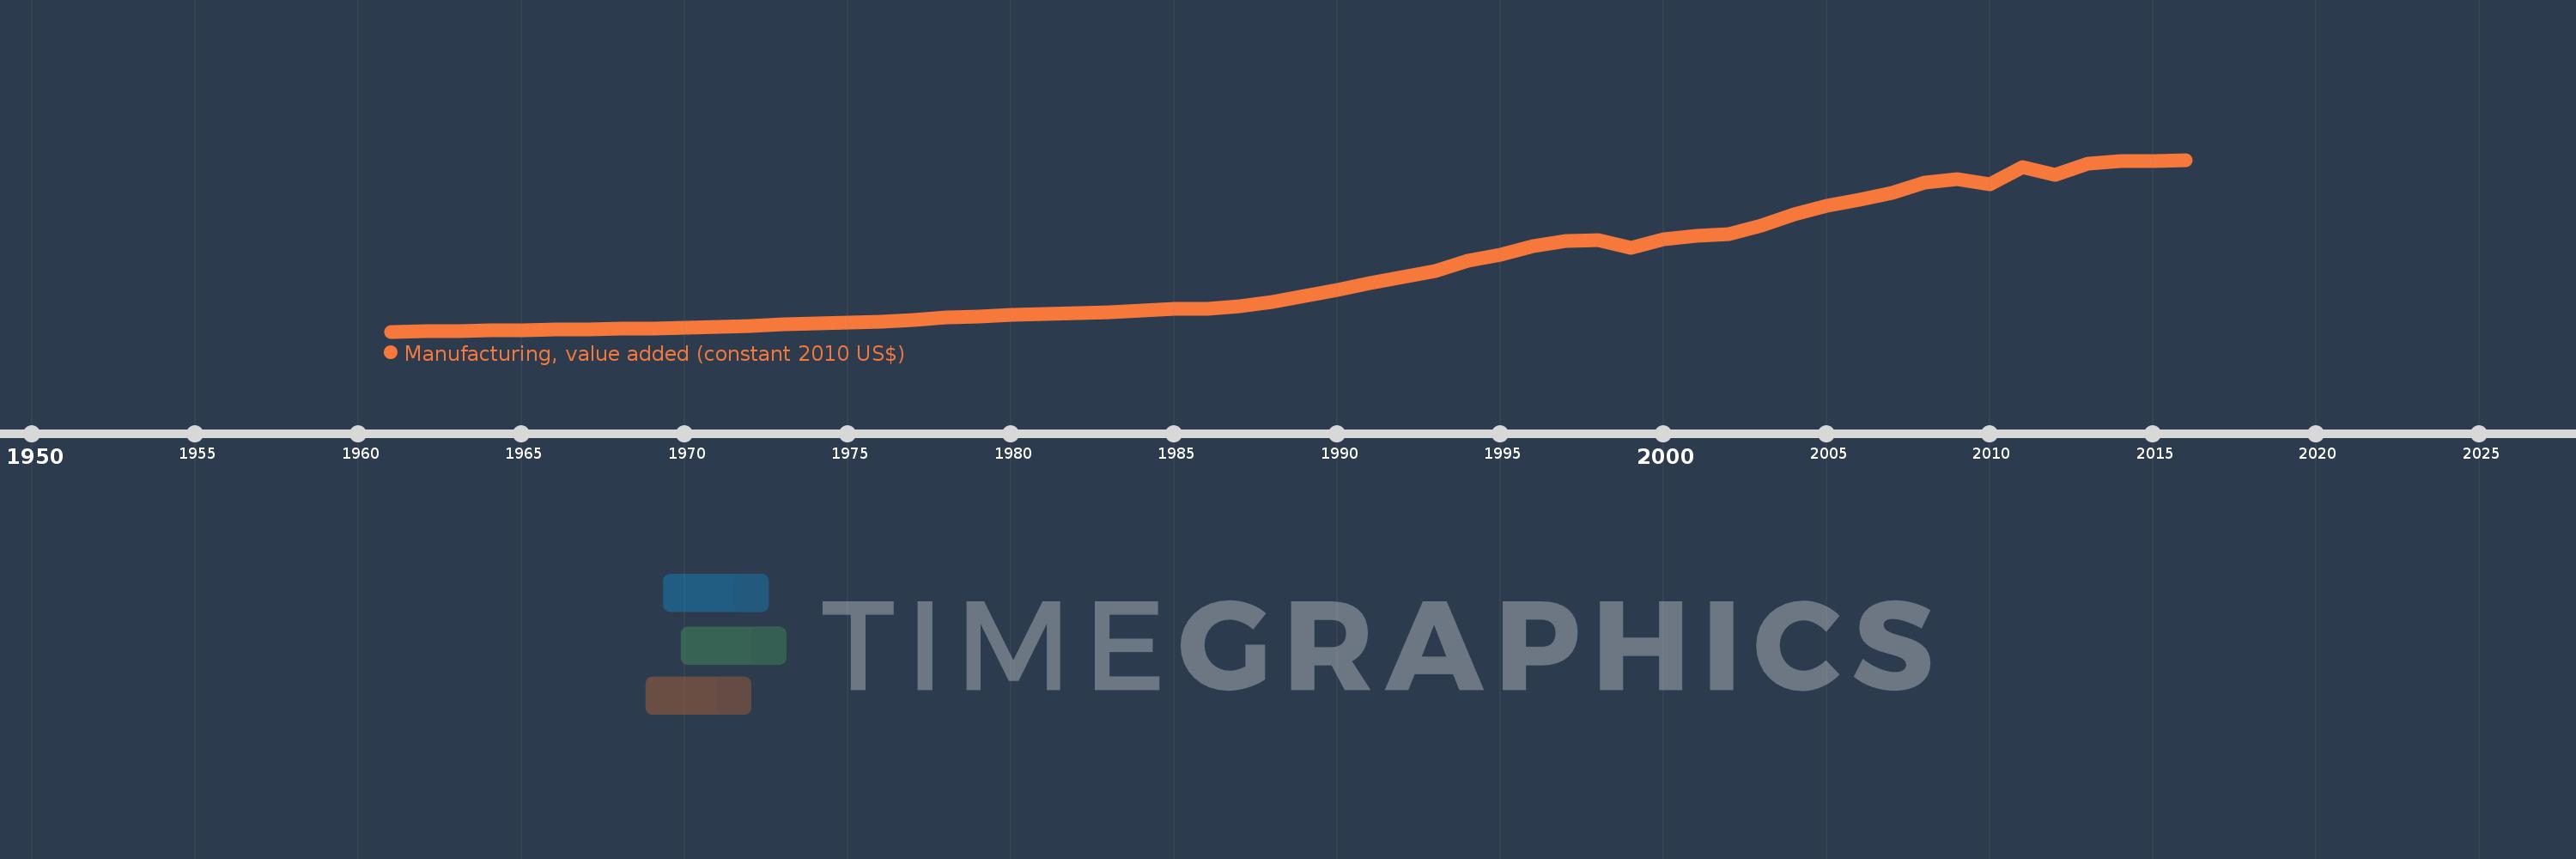
Manufacturing, value added (constant 2010 US$)
2016,2015,2014,2013,2012,2011,2010,2009,2008,2007,2006,2005,2004,2003,2002,2001,2000,1999,1998,1997,1996,1995,1994,1993,1992,1991,1990,1989,1988,1987,1986,1985,1984,1983,1982,1981,1980,1979,1978,1977,1976,1975,1974,1973,1972,1971,1970,1969,1968,1967,1966,1965,1964,1963,1962,1961
This statistics in other country:
AfghanistanAlbaniaAndorraAntigua and BarbudaArab WorldArgentinaArmeniaArubaAustraliaAustriaAzerbaijanBahamas, TheBahrainBangladeshBarbadosBelarusBelgiumBelizeBeninBermudaBhutanBoliviaBosnia and HerzegovinaBotswanaBrazilBrunei DarussalamBurkina FasoBurundiCambodiaCameroonCanadaCaribbean small statesCentral African RepublicCentral Europe and the BalticsChadChileChinaColombiaComorosCongo, Dem. Rep.Congo, Rep.Costa RicaCote d'IvoireCroatiaCubaCyprusCzech RepublicDenmarkDominicaDominican RepublicEarly-demographic dividendEast Asia & PacificEast Asia & Pacific (excluding high income)East Asia & Pacific (IDA & IBRD countries)EcuadorEgypt, Arab Rep.El SalvadorEquatorial GuineaEstoniaEthiopiaEuro areaEurope & Central AsiaEurope & Central Asia (excluding high income)Europe & Central Asia (IDA & IBRD countries)European UnionFaroe IslandsFijiFinlandFragile and conflict affected situationsFranceGabonGambia, TheGeorgiaGermanyGhanaGreeceGrenadaGuatemalaGuineaGuyanaHeavily indebted poor countries (HIPC)High incomeHondurasHong Kong SAR, ChinaHungaryIBRD onlyIcelandIDA & IBRD totalIDA blendIDA onlyIDA totalIndiaIndonesiaIran, Islamic Rep.IraqIrelandItalyJamaicaJapanJordanKazakhstanKenyaKiribatiKorea, Rep.KosovoKuwaitKyrgyz RepublicLao PDRLate-demographic dividendLatin America & Caribbean Latin America & Caribbean (excluding high income)Latin America & the Caribbean (IDA & IBRD countries)LatviaLeast developed countries: UN classificationLebanonLesothoLiberiaLithuaniaLow & middle incomeLow incomeLower middle incomeLuxembourgMacao SAR, ChinaMacedonia, FYRMalawiMalaysiaMaldivesMaltaMarshall IslandsMauritaniaMauritiusMexicoMicronesia, Fed. Sts.Middle East & North AfricaMiddle East & North Africa (excluding high income)Middle East & North Africa (IDA & IBRD countries)Middle incomeMoldovaMongoliaMontenegroMoroccoMozambiqueMyanmarNamibiaNepalNetherlandsNew ZealandNicaraguaNigerNigeriaNorth AmericaNorwayOECD membersOmanOther small statesPacific island small statesPakistanPalauPanamaParaguayPeruPhilippinesPolandPortugalPost-demographic dividendPre-demographic dividendPuerto RicoQatarRomaniaRussian FederationRwandaSamoaSao Tome and PrincipeSaudi ArabiaSenegalSerbiaSeychellesSierra LeoneSingaporeSlovak RepublicSloveniaSmall statesSouth AfricaSouth AsiaSouth Asia (IDA & IBRD)SpainSri LankaSt. Kitts and NevisSt. LuciaSt. Vincent and the GrenadinesSub-Saharan Africa Sub-Saharan Africa (excluding high income)Sub-Saharan Africa (IDA & IBRD countries)SudanSurinameSwazilandSwedenSwitzerlandTajikistanTanzaniaThailandTimor-LesteTogoTongaTrinidad and TobagoTunisiaTurkeyTuvaluUgandaUkraineUnited Arab EmiratesUnited KingdomUnited StatesUpper middle incomeUruguayUzbekistanVanuatuVenezuela, RBVietnamWest Bank and GazaWorldYemen, Rep.ZambiaZimbabwe Timeline:
This timeline shows a graph from 1961 to 2016 of Thailand. No data until 1960. Number of actual observations by date: 56.
Source name:
World Development Indicators
Source organization:
World Bank national accounts data, and OECD National Accounts data files.
Categories, topics:
Economy & Growth
Last updated:
apr 23, 2017
Indicators value changes by year
Minimum:
1.607 bln
jan 1, 1961
Maximum:
110.432 bln
jan 1, 2016
At the date of observation
Value
Absolute change
Change from previous value
jan 1, 1961
1.607 bln
+1.607 bln
0.0%
jan 1, 1962
1.772 bln
+164.834 mln
10.26%
jan 1, 1963
1.978 bln
+206.029 mln
11.63%
jan 1, 1964
2.163 bln
+185.452 mln
9.38%
jan 1, 1965
2.349 bln
+185.429 mln
8.57%
jan 1, 1966
2.74 bln
+391.481 mln
16.67%
jan 1, 1967
3.049 bln
+309.067 mln
11.28%
jan 1, 1968
3.42 bln
+370.863 mln
12.16%
jan 1, 1969
3.668 bln
+247.26 mln
7.23%
jan 1, 1970
4.141 bln
+473.884 mln
12.92%
jan 1, 1971
4.802 bln
+660.684 mln
15.95%
jan 1, 1972
5.323 bln
+520.71 mln
10.84%
jan 1, 1973
6.036 bln
+713.593 mln
13.41%
jan 1, 1974
6.981 bln
+944.963 mln
15.65%
jan 1, 1975
7.425 bln
+443.553 mln
6.35%
jan 1, 1976
7.849 bln
+424.307 mln
5.71%
jan 1, 1977
9.045 bln
+1.196 bln
15.23%
jan 1, 1978
10.356 bln
+1.311 bln
14.5%
jan 1, 1979
11.244 bln
+887.165 mln
8.57%
jan 1, 1980
12.188 bln
+944.964 mln
8.4%
jan 1, 1981
12.536 bln
+347.143 mln
2.85%
jan 1, 1982
13.323 bln
+787.845 mln
6.28%
jan 1, 1983
13.676 bln
+352.906 mln
2.65%
jan 1, 1984
15.207 bln
+1.53 bln
11.19%
jan 1, 1985
16.149 bln
+942.111 mln
6.2%
jan 1, 1986
15.928 bln
-221.092 mln
-1.37%
jan 1, 1987
17.495 bln
+1.567 bln
9.84%
jan 1, 1988
20.301 bln
+2.805 bln
16.04%
jan 1, 1989
23.941 bln
+3.64 bln
17.93%
jan 1, 1990
27.778 bln
+3.837 bln
16.03%
jan 1, 1991
32.132 bln
+4.354 bln
15.67%
jan 1, 1992
35.899 bln
+3.766 bln
11.72%
jan 1, 1993
39.956 bln
+4.057 bln
11.3%
jan 1, 1994
46.444 bln
+6.488 bln
16.24%
jan 1, 1995
50.334 bln
+3.89 bln
8.38%
jan 1, 1996
55.96 bln
+5.626 bln
11.18%
jan 1, 1997
59.154 bln
+3.194 bln
5.71%
jan 1, 1998
59.669 bln
+515.455 mln
0.87%
jan 1, 1999
54.668 bln
-5.001 bln
-8.38%
jan 1, 2000
60.029 bln
+5.361 bln
9.81%
jan 1, 2001
62.017 bln
+1.989 bln
3.31%
jan 1, 2002
63.232 bln
+1.215 bln
1.96%
jan 1, 2003
68.812 bln
+5.579 bln
8.82%
jan 1, 2004
75.8 bln
+6.989 bln
10.16%
jan 1, 2005
81.453 bln
+5.653 bln
7.46%
jan 1, 2006
84.883 bln
+3.43 bln
4.21%
jan 1, 2007
89.646 bln
+4.762 bln
5.61%
jan 1, 2008
96.128 bln
+6.483 bln
7.23%
jan 1, 2009
98.424 bln
+2.296 bln
2.39%
jan 1, 2010
95.166 bln
-3.257 bln
-3.31%
jan 1, 2011
105.987 bln
+10.821 bln
11.37%
jan 1, 2012
100.866 bln
-5.121 bln
-4.83%
jan 1, 2013
107.825 bln
+6.959 bln
6.9%
jan 1, 2014
109.681 bln
+1.855 bln
1.72%
jan 1, 2015
109.417 bln
-263.604 mln
-0.24%
jan 1, 2016
110.432 bln
+1.015 bln
0.93%
Ranking of countries by current statistics by years


Comments: