29
/
en
AIzaSyAYiBZKx7MnpbEhh9jyipgxe19OcubqV5w
April 1, 2024
287217
Zimbabwe
ZWE
true
2
1
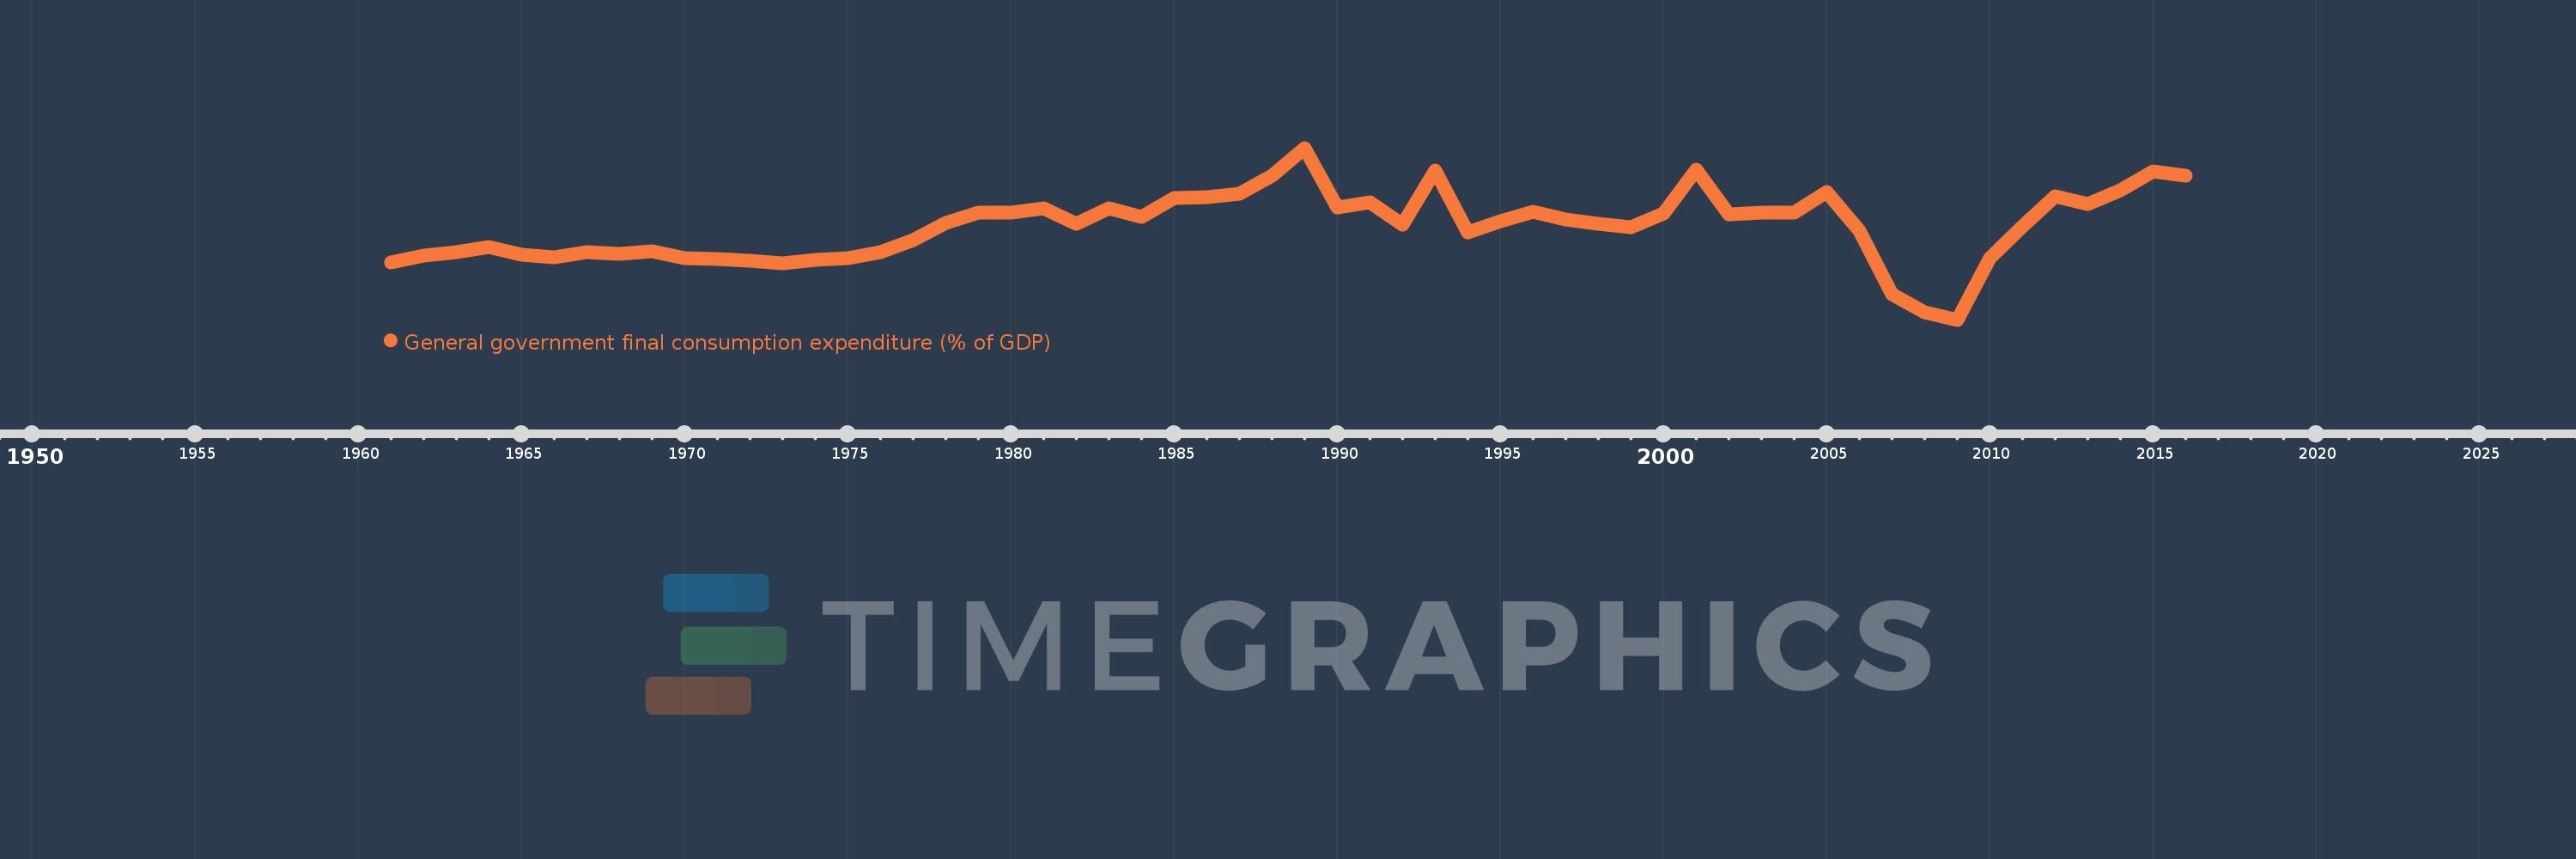
General government final consumption expenditure (% of GDP)
2016,2015,2014,2013,2012,2011,2010,2009,2008,2007,2006,2005,2004,2003,2002,2001,2000,1999,1998,1997,1996,1995,1994,1993,1992,1991,1990,1989,1988,1987,1986,1985,1984,1983,1982,1981,1980,1979,1978,1977,1976,1975,1974,1973,1972,1971,1970,1969,1968,1967,1966,1965,1964,1963,1962,1961
This statistics in other country:
AfghanistanAlbaniaAlgeriaAngolaAntigua and BarbudaArab WorldArgentinaArmeniaArubaAustraliaAustriaAzerbaijanBahamas, TheBahrainBangladeshBarbadosBelarusBelgiumBelizeBeninBermudaBhutanBoliviaBosnia and HerzegovinaBotswanaBrazilBrunei DarussalamBulgariaBurkina FasoBurundiCabo VerdeCambodiaCameroonCanadaCaribbean small statesCentral African RepublicCentral Europe and the BalticsChadChileChinaColombiaComorosCongo, Dem. Rep.Congo, Rep.Costa RicaCote d'IvoireCroatiaCubaCyprusCzech RepublicDenmarkDjiboutiDominicaDominican RepublicEarly-demographic dividendEast Asia & PacificEast Asia & Pacific (excluding high income)East Asia & Pacific (IDA & IBRD countries)EcuadorEgypt, Arab Rep.El SalvadorEquatorial GuineaEritreaEstoniaEthiopiaEuro areaEurope & Central AsiaEurope & Central Asia (excluding high income)Europe & Central Asia (IDA & IBRD countries)European UnionFaroe IslandsFijiFinlandFragile and conflict affected situationsFranceFrench PolynesiaGabonGambia, TheGeorgiaGermanyGhanaGreeceGrenadaGuatemalaGuineaGuinea-BissauGuyanaHaitiHeavily indebted poor countries (HIPC)High incomeHondurasHong Kong SAR, ChinaHungaryIBRD onlyIcelandIDA & IBRD totalIDA blendIDA onlyIDA totalIndiaIndonesiaIran, Islamic Rep.IraqIrelandIsraelItalyJamaicaJapanJordanKazakhstanKenyaKiribatiKorea, Rep.KosovoKuwaitKyrgyz RepublicLao PDRLate-demographic dividendLatin America & Caribbean Latin America & Caribbean (excluding high income)Latin America & the Caribbean (IDA & IBRD countries)LatviaLeast developed countries: UN classificationLebanonLesothoLiberiaLibyaLithuaniaLow & middle incomeLow incomeLower middle incomeLuxembourgMacao SAR, ChinaMacedonia, FYRMadagascarMalawiMalaysiaMaldivesMaliMaltaMauritaniaMauritiusMexicoMicronesia, Fed. Sts.Middle East & North AfricaMiddle East & North Africa (excluding high income)Middle East & North Africa (IDA & IBRD countries)Middle incomeMoldovaMongoliaMontenegroMoroccoMozambiqueNamibiaNepalNetherlandsNew CaledoniaNew ZealandNicaraguaNigerNigeriaNorth AmericaNorwayOECD membersOmanOther small statesPacific island small statesPakistanPanamaPapua New GuineaParaguayPeruPhilippinesPolandPortugalPost-demographic dividendPre-demographic dividendPuerto RicoQatarRomaniaRussian FederationRwandaSaudi ArabiaSenegalSerbiaSeychellesSierra LeoneSingaporeSlovak RepublicSloveniaSmall statesSolomon IslandsSomaliaSouth AfricaSouth AsiaSouth Asia (IDA & IBRD)South SudanSpainSri LankaSt. Kitts and NevisSt. LuciaSt. Vincent and the GrenadinesSub-Saharan Africa Sub-Saharan Africa (excluding high income)Sub-Saharan Africa (IDA & IBRD countries)SudanSurinameSwazilandSwedenSwitzerlandSyrian Arab RepublicTajikistanTanzaniaThailandTimor-LesteTogoTongaTrinidad and TobagoTunisiaTurkeyTurkmenistanUgandaUkraineUnited Arab EmiratesUnited KingdomUnited StatesUpper middle incomeUruguayUzbekistanVanuatuVenezuela, RBVietnamWest Bank and GazaWorldYemen, Rep.ZambiaZimbabwe Timeline:
This timeline shows a graph from 1961 to 2016 of Zimbabwe. No data until 1960. Number of actual observations by date: 56.
Source name:
World Development Indicators
Source organization:
World Bank national accounts data, and OECD National Accounts data files.
Categories, topics:
Economy & Growth
Last updated:
apr 23, 2017
Indicators value changes by year
Maximum:
27.487
jan 1, 1989
At the date of observation
Value
Absolute change
Change from previous value
jan 1, 1961
10.548
+10.548
0.0%
jan 1, 1962
11.611
+1.063
10.08%
jan 1, 1963
12.055
+0.444
3.82%
jan 1, 1964
12.866
+0.811
6.73%
jan 1, 1965
11.704
-1.163
-9.04%
jan 1, 1966
11.238
-0.466
-3.98%
jan 1, 1967
12.011
+0.773
6.88%
jan 1, 1968
11.82
-0.191
-1.59%
jan 1, 1969
12.182
+0.362
3.06%
jan 1, 1970
11.185
-0.996
-8.18%
jan 1, 1971
10.987
-0.198
-1.77%
jan 1, 1972
10.816
-0.172
-1.56%
jan 1, 1973
10.41
-0.406
-3.75%
jan 1, 1974
10.905
+0.495
4.76%
jan 1, 1975
11.173
+0.268
2.46%
jan 1, 1976
12.055
+0.882
7.89%
jan 1, 1977
13.857
+1.802
14.94%
jan 1, 1978
16.352
+2.495
18.01%
jan 1, 1979
17.958
+1.606
9.82%
jan 1, 1980
17.904
-0.053
-0.3%
jan 1, 1981
18.512
+0.607
3.39%
jan 1, 1982
16.194
-2.317
-12.52%
jan 1, 1983
18.593
+2.399
14.81%
jan 1, 1984
17.293
-1.3
-6.99%
jan 1, 1985
20.04
+2.747
15.89%
jan 1, 1986
20.203
+0.163
0.81%
jan 1, 1987
20.648
+0.445
2.2%
jan 1, 1988
23.366
+2.718
13.16%
jan 1, 1989
27.487
+4.121
17.64%
jan 1, 1990
18.69
-8.797
-32.0%
jan 1, 1991
19.446
+0.756
4.04%
jan 1, 1992
16.12
-3.326
-17.11%
jan 1, 1993
24.158
+8.038
49.87%
jan 1, 1994
14.947
-9.211
-38.13%
jan 1, 1995
16.694
+1.747
11.69%
jan 1, 1996
18.013
+1.319
7.9%
jan 1, 1997
16.94
-1.073
-5.96%
jan 1, 1998
16.315
-0.625
-3.69%
jan 1, 1999
15.784
-0.531
-3.25%
jan 1, 2000
17.791
+2.007
12.71%
jan 1, 2001
24.265
+6.474
36.39%
jan 1, 2002
17.693
-6.573
-27.09%
jan 1, 2003
17.924
+0.231
1.3%
jan 1, 2004
17.916
-0.007
-0.04%
jan 1, 2005
21.001
+3.084
17.22%
jan 1, 2006
15.211
-5.789
-27.57%
jan 1, 2007
5.883
-9.329
-61.33%
jan 1, 2008
3.208
-2.674
-45.46%
jan 1, 2009
2.047
-1.161
-36.19%
jan 1, 2010
11.172
+9.125
445.73%
jan 1, 2011
15.89
+4.719
42.24%
jan 1, 2012
20.29
+4.4
27.69%
jan 1, 2013
19.137
-1.153
-5.68%
jan 1, 2014
21.215
+2.078
10.86%
jan 1, 2015
24.056
+2.841
13.39%
jan 1, 2016
23.406
-0.649
-2.7%
Ranking of countries by current statistics by years


Comments: