29
/
en
AIzaSyAYiBZKx7MnpbEhh9jyipgxe19OcubqV5w
April 1, 2024
186521
Malawi
MWI
true
2
1
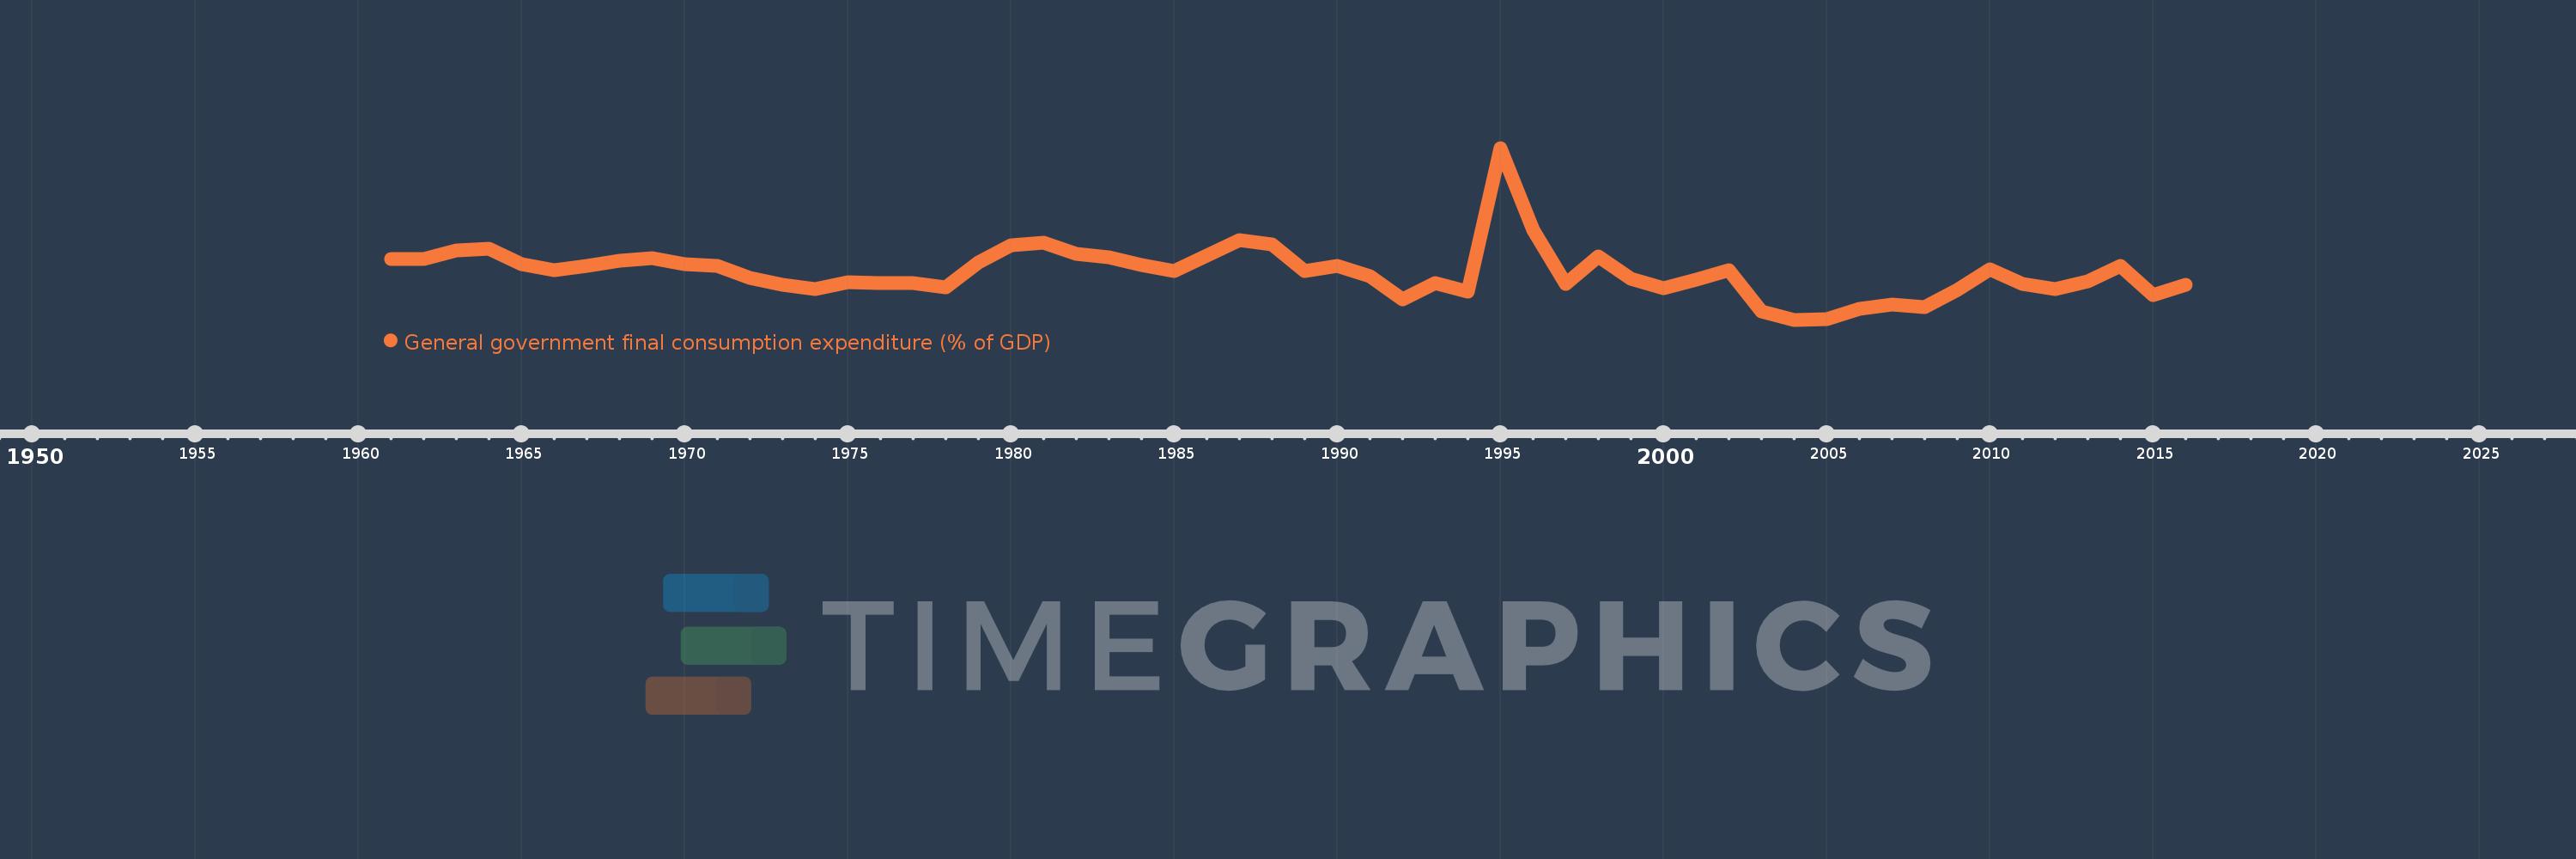
General government final consumption expenditure (% of GDP)
2016,2015,2014,2013,2012,2011,2010,2009,2008,2007,2006,2005,2004,2003,2002,2001,2000,1999,1998,1997,1996,1995,1994,1993,1992,1991,1990,1989,1988,1987,1986,1985,1984,1983,1982,1981,1980,1979,1978,1977,1976,1975,1974,1973,1972,1971,1970,1969,1968,1967,1966,1965,1964,1963,1962,1961
This statistics in other country:
AfghanistanAlbaniaAlgeriaAngolaAntigua and BarbudaArab WorldArgentinaArmeniaArubaAustraliaAustriaAzerbaijanBahamas, TheBahrainBangladeshBarbadosBelarusBelgiumBelizeBeninBermudaBhutanBoliviaBosnia and HerzegovinaBotswanaBrazilBrunei DarussalamBulgariaBurkina FasoBurundiCabo VerdeCambodiaCameroonCanadaCaribbean small statesCentral African RepublicCentral Europe and the BalticsChadChileChinaColombiaComorosCongo, Dem. Rep.Congo, Rep.Costa RicaCote d'IvoireCroatiaCubaCyprusCzech RepublicDenmarkDjiboutiDominicaDominican RepublicEarly-demographic dividendEast Asia & PacificEast Asia & Pacific (excluding high income)East Asia & Pacific (IDA & IBRD countries)EcuadorEgypt, Arab Rep.El SalvadorEquatorial GuineaEritreaEstoniaEthiopiaEuro areaEurope & Central AsiaEurope & Central Asia (excluding high income)Europe & Central Asia (IDA & IBRD countries)European UnionFaroe IslandsFijiFinlandFragile and conflict affected situationsFranceFrench PolynesiaGabonGambia, TheGeorgiaGermanyGhanaGreeceGrenadaGuatemalaGuineaGuinea-BissauGuyanaHaitiHeavily indebted poor countries (HIPC)High incomeHondurasHong Kong SAR, ChinaHungaryIBRD onlyIcelandIDA & IBRD totalIDA blendIDA onlyIDA totalIndiaIndonesiaIran, Islamic Rep.IraqIrelandIsraelItalyJamaicaJapanJordanKazakhstanKenyaKiribatiKorea, Rep.KosovoKuwaitKyrgyz RepublicLao PDRLate-demographic dividendLatin America & Caribbean Latin America & Caribbean (excluding high income)Latin America & the Caribbean (IDA & IBRD countries)LatviaLeast developed countries: UN classificationLebanonLesothoLiberiaLibyaLithuaniaLow & middle incomeLow incomeLower middle incomeLuxembourgMacao SAR, ChinaMacedonia, FYRMadagascarMalawiMalaysiaMaldivesMaliMaltaMauritaniaMauritiusMexicoMicronesia, Fed. Sts.Middle East & North AfricaMiddle East & North Africa (excluding high income)Middle East & North Africa (IDA & IBRD countries)Middle incomeMoldovaMongoliaMontenegroMoroccoMozambiqueNamibiaNepalNetherlandsNew CaledoniaNew ZealandNicaraguaNigerNigeriaNorth AmericaNorwayOECD membersOmanOther small statesPacific island small statesPakistanPanamaPapua New GuineaParaguayPeruPhilippinesPolandPortugalPost-demographic dividendPre-demographic dividendPuerto RicoQatarRomaniaRussian FederationRwandaSaudi ArabiaSenegalSerbiaSeychellesSierra LeoneSingaporeSlovak RepublicSloveniaSmall statesSolomon IslandsSomaliaSouth AfricaSouth AsiaSouth Asia (IDA & IBRD)South SudanSpainSri LankaSt. Kitts and NevisSt. LuciaSt. Vincent and the GrenadinesSub-Saharan Africa Sub-Saharan Africa (excluding high income)Sub-Saharan Africa (IDA & IBRD countries)SudanSurinameSwazilandSwedenSwitzerlandSyrian Arab RepublicTajikistanTanzaniaThailandTimor-LesteTogoTongaTrinidad and TobagoTunisiaTurkeyTurkmenistanUgandaUkraineUnited Arab EmiratesUnited KingdomUnited StatesUpper middle incomeUruguayUzbekistanVanuatuVenezuela, RBVietnamWest Bank and GazaWorldYemen, Rep.ZambiaZimbabwe Timeline:
This timeline shows a graph from 1961 to 2016 of Malawi. No data until 1960. Number of actual observations by date: 56.
Source name:
World Development Indicators
Source organization:
World Bank national accounts data, and OECD National Accounts data files.
Categories, topics:
Economy & Growth
Last updated:
apr 23, 2017
Indicators value changes by year
Maximum:
31.554
jan 1, 1995
At the date of observation
Value
Absolute change
Change from previous value
jan 1, 1961
17.268
+17.268
0.0%
jan 1, 1962
17.241
-0.027
-0.15%
jan 1, 1963
18.349
+1.107
6.42%
jan 1, 1964
18.562
+0.213
1.16%
jan 1, 1965
16.535
-2.027
-10.92%
jan 1, 1966
15.802
-0.733
-4.43%
jan 1, 1967
16.398
+0.596
3.77%
jan 1, 1968
17.042
+0.644
3.93%
jan 1, 1969
17.376
+0.334
1.96%
jan 1, 1970
16.524
-0.853
-4.91%
jan 1, 1971
16.357
-0.167
-1.01%
jan 1, 1972
14.822
-1.535
-9.38%
jan 1, 1973
13.886
-0.936
-6.31%
jan 1, 1974
13.379
-0.507
-3.65%
jan 1, 1975
14.236
+0.857
6.41%
jan 1, 1976
14.102
-0.134
-0.94%
jan 1, 1977
14.101
-0.001
-0.01%
jan 1, 1978
13.544
-0.557
-3.95%
jan 1, 1979
16.76
+3.216
23.75%
jan 1, 1980
18.971
+2.21
13.19%
jan 1, 1981
19.292
+0.321
1.69%
jan 1, 1982
17.868
-1.423
-7.38%
jan 1, 1983
17.502
-0.367
-2.05%
jan 1, 1984
16.416
-1.085
-6.2%
jan 1, 1985
15.696
-0.72
-4.38%
jan 1, 1986
17.687
+1.991
12.68%
jan 1, 1987
19.692
+2.005
11.34%
jan 1, 1988
19.104
-0.588
-2.99%
jan 1, 1989
15.711
-3.392
-17.76%
jan 1, 1990
16.335
+0.623
3.97%
jan 1, 1991
15.059
-1.276
-7.81%
jan 1, 1992
12.009
-3.05
-20.26%
jan 1, 1993
14.085
+2.076
17.29%
jan 1, 1994
13.03
-1.055
-7.49%
jan 1, 1995
31.554
+18.524
142.17%
jan 1, 1996
20.95
-10.604
-33.61%
jan 1, 1997
13.981
-6.969
-33.27%
jan 1, 1998
17.52
+3.539
25.32%
jan 1, 1999
14.684
-2.837
-16.19%
jan 1, 2000
13.446
-1.238
-8.43%
jan 1, 2001
14.578
+1.132
8.42%
jan 1, 2002
15.809
+1.231
8.44%
jan 1, 2003
10.507
-5.302
-33.54%
jan 1, 2004
9.398
-1.109
-10.56%
jan 1, 2005
9.44
+0.042
0.44%
jan 1, 2006
10.788
+1.348
14.28%
jan 1, 2007
11.394
+0.606
5.62%
jan 1, 2008
10.994
-0.4
-3.51%
jan 1, 2009
13.228
+2.234
20.32%
jan 1, 2010
15.946
+2.718
20.55%
jan 1, 2011
14.023
-1.923
-12.06%
jan 1, 2012
13.404
-0.619
-4.42%
jan 1, 2013
14.385
+0.981
7.32%
jan 1, 2014
16.367
+1.982
13.78%
jan 1, 2015
12.538
-3.829
-23.4%
jan 1, 2016
13.866
+1.328
10.59%
Ranking of countries by current statistics by years


Comments: