29
/
en
AIzaSyAYiBZKx7MnpbEhh9jyipgxe19OcubqV5w
April 1, 2024
118919
Denmark
DNK
true
2
1
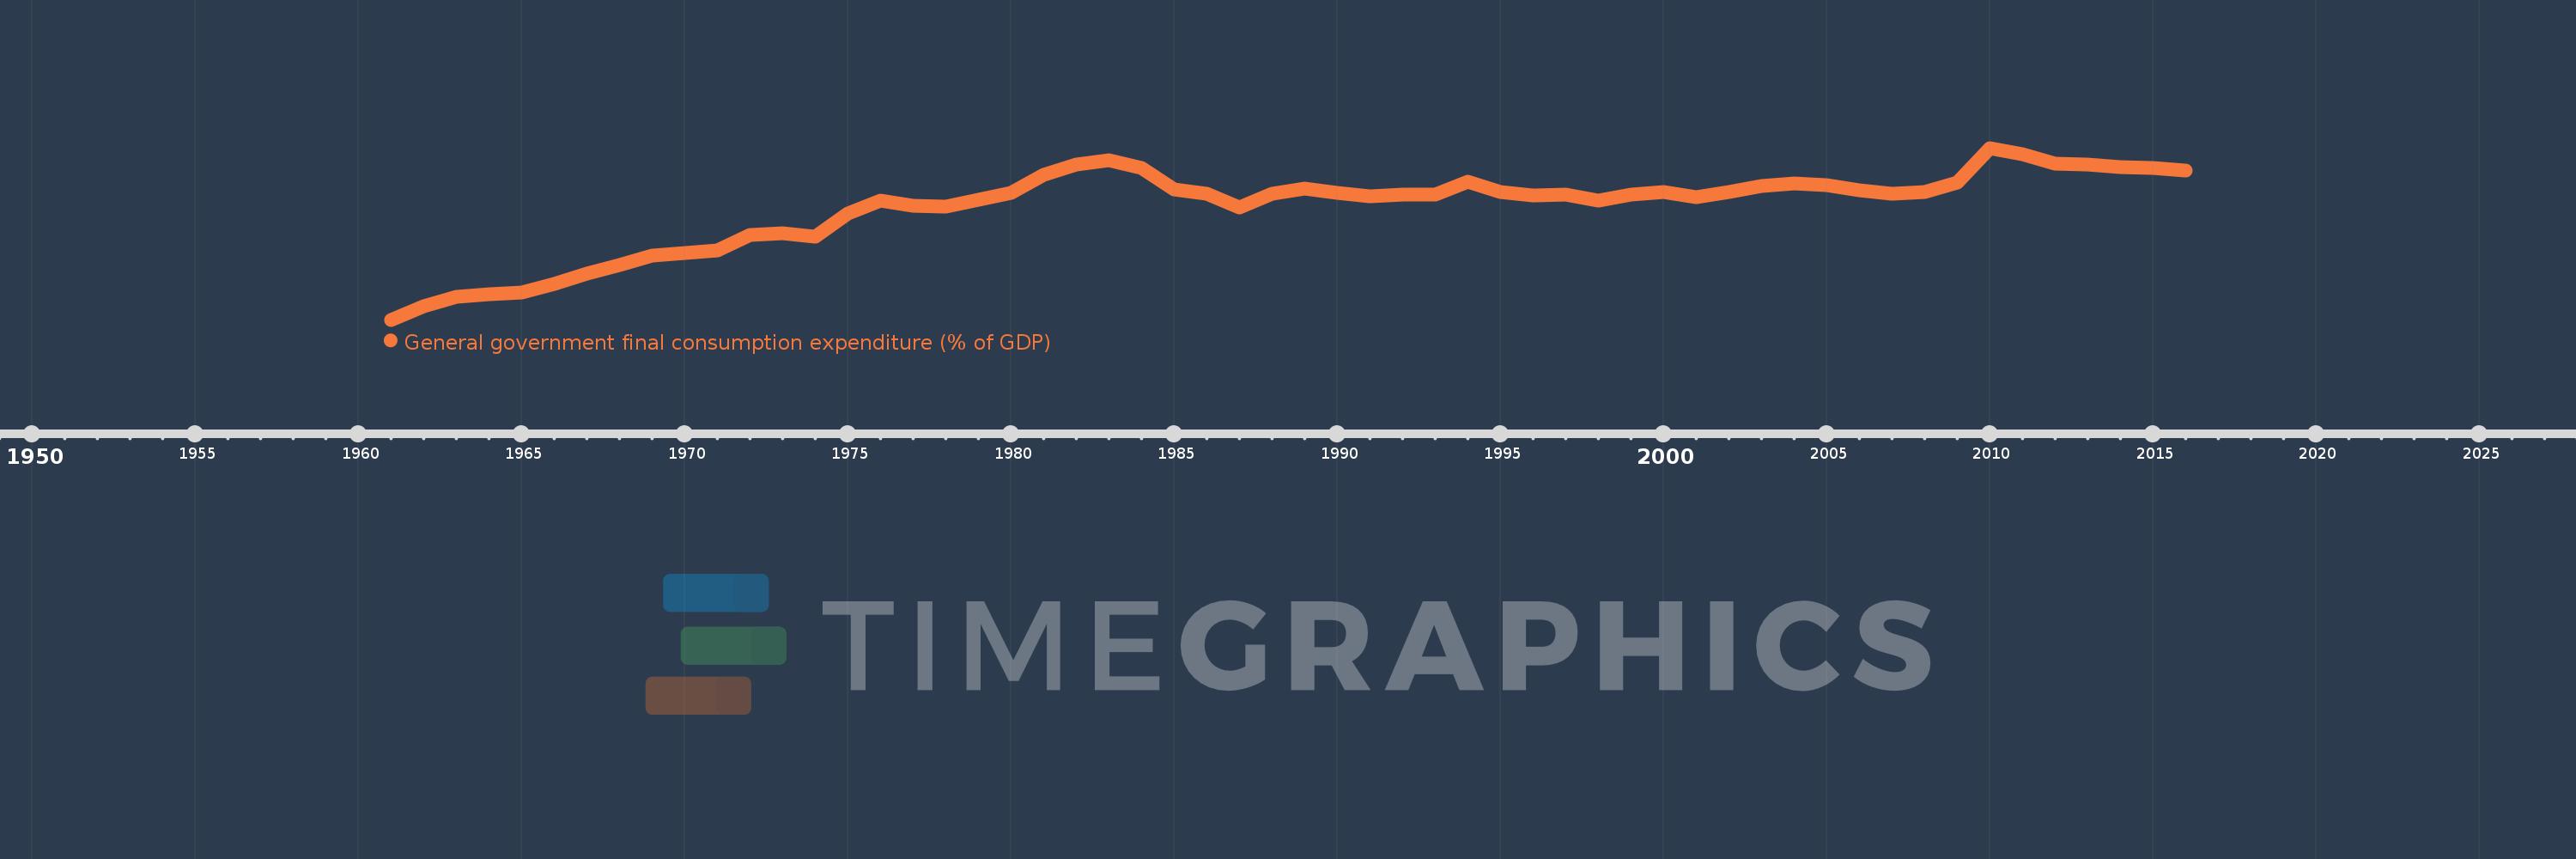
General government final consumption expenditure (% of GDP)
2016,2015,2014,2013,2012,2011,2010,2009,2008,2007,2006,2005,2004,2003,2002,2001,2000,1999,1998,1997,1996,1995,1994,1993,1992,1991,1990,1989,1988,1987,1986,1985,1984,1983,1982,1981,1980,1979,1978,1977,1976,1975,1974,1973,1972,1971,1970,1969,1968,1967,1966,1965,1964,1963,1962,1961
This statistics in other country:
AfghanistanAlbaniaAlgeriaAngolaAntigua and BarbudaArab WorldArgentinaArmeniaArubaAustraliaAustriaAzerbaijanBahamas, TheBahrainBangladeshBarbadosBelarusBelgiumBelizeBeninBermudaBhutanBoliviaBosnia and HerzegovinaBotswanaBrazilBrunei DarussalamBulgariaBurkina FasoBurundiCabo VerdeCambodiaCameroonCanadaCaribbean small statesCentral African RepublicCentral Europe and the BalticsChadChileChinaColombiaComorosCongo, Dem. Rep.Congo, Rep.Costa RicaCote d'IvoireCroatiaCubaCyprusCzech RepublicDenmarkDjiboutiDominicaDominican RepublicEarly-demographic dividendEast Asia & PacificEast Asia & Pacific (excluding high income)East Asia & Pacific (IDA & IBRD countries)EcuadorEgypt, Arab Rep.El SalvadorEquatorial GuineaEritreaEstoniaEthiopiaEuro areaEurope & Central AsiaEurope & Central Asia (excluding high income)Europe & Central Asia (IDA & IBRD countries)European UnionFaroe IslandsFijiFinlandFragile and conflict affected situationsFranceFrench PolynesiaGabonGambia, TheGeorgiaGermanyGhanaGreeceGrenadaGuatemalaGuineaGuinea-BissauGuyanaHaitiHeavily indebted poor countries (HIPC)High incomeHondurasHong Kong SAR, ChinaHungaryIBRD onlyIcelandIDA & IBRD totalIDA blendIDA onlyIDA totalIndiaIndonesiaIran, Islamic Rep.IraqIrelandIsraelItalyJamaicaJapanJordanKazakhstanKenyaKiribatiKorea, Rep.KosovoKuwaitKyrgyz RepublicLao PDRLate-demographic dividendLatin America & Caribbean Latin America & Caribbean (excluding high income)Latin America & the Caribbean (IDA & IBRD countries)LatviaLeast developed countries: UN classificationLebanonLesothoLiberiaLibyaLithuaniaLow & middle incomeLow incomeLower middle incomeLuxembourgMacao SAR, ChinaMacedonia, FYRMadagascarMalawiMalaysiaMaldivesMaliMaltaMauritaniaMauritiusMexicoMicronesia, Fed. Sts.Middle East & North AfricaMiddle East & North Africa (excluding high income)Middle East & North Africa (IDA & IBRD countries)Middle incomeMoldovaMongoliaMontenegroMoroccoMozambiqueNamibiaNepalNetherlandsNew CaledoniaNew ZealandNicaraguaNigerNigeriaNorth AmericaNorwayOECD membersOmanOther small statesPacific island small statesPakistanPanamaPapua New GuineaParaguayPeruPhilippinesPolandPortugalPost-demographic dividendPre-demographic dividendPuerto RicoQatarRomaniaRussian FederationRwandaSaudi ArabiaSenegalSerbiaSeychellesSierra LeoneSingaporeSlovak RepublicSloveniaSmall statesSolomon IslandsSomaliaSouth AfricaSouth AsiaSouth Asia (IDA & IBRD)South SudanSpainSri LankaSt. Kitts and NevisSt. LuciaSt. Vincent and the GrenadinesSub-Saharan Africa Sub-Saharan Africa (excluding high income)Sub-Saharan Africa (IDA & IBRD countries)SudanSurinameSwazilandSwedenSwitzerlandSyrian Arab RepublicTajikistanTanzaniaThailandTimor-LesteTogoTongaTrinidad and TobagoTunisiaTurkeyTurkmenistanUgandaUkraineUnited Arab EmiratesUnited KingdomUnited StatesUpper middle incomeUruguayUzbekistanVanuatuVenezuela, RBVietnamWest Bank and GazaWorldYemen, Rep.ZambiaZimbabwe Timeline:
This timeline shows a graph from 1961 to 2016 of Denmark. No data until 1960. Number of actual observations by date: 56.
Source name:
World Development Indicators
Source organization:
World Bank national accounts data, and OECD National Accounts data files.
Categories, topics:
Economy & Growth
Last updated:
apr 23, 2017
Indicators value changes by year
Minimum:
13.517
jan 1, 1961
Maximum:
28.064
jan 1, 2010
At the date of observation
Value
Absolute change
Change from previous value
jan 1, 1961
13.517
+13.517
0.0%
jan 1, 1962
14.694
+1.177
8.7%
jan 1, 1963
15.459
+0.766
5.21%
jan 1, 1964
15.712
+0.253
1.64%
jan 1, 1965
15.831
+0.119
0.76%
jan 1, 1966
16.584
+0.753
4.75%
jan 1, 1967
17.416
+0.832
5.02%
jan 1, 1968
18.15
+0.735
4.22%
jan 1, 1969
18.94
+0.79
4.35%
jan 1, 1970
19.204
+0.264
1.39%
jan 1, 1971
19.365
+0.161
0.84%
jan 1, 1972
20.704
+1.34
6.92%
jan 1, 1973
20.815
+0.111
0.54%
jan 1, 1974
20.583
-0.233
-1.12%
jan 1, 1975
22.517
+1.934
9.4%
jan 1, 1976
23.628
+1.112
4.94%
jan 1, 1977
23.17
-0.458
-1.94%
jan 1, 1978
23.111
-0.059
-0.25%
jan 1, 1979
23.655
+0.544
2.35%
jan 1, 1980
24.288
+0.632
2.67%
jan 1, 1981
25.798
+1.51
6.22%
jan 1, 1982
26.647
+0.85
3.29%
jan 1, 1983
27.037
+0.39
1.46%
jan 1, 1984
26.345
-0.692
-2.56%
jan 1, 1985
24.543
-1.802
-6.84%
jan 1, 1986
24.161
-0.382
-1.56%
jan 1, 1987
23.047
-1.114
-4.61%
jan 1, 1988
24.157
+1.11
4.82%
jan 1, 1989
24.628
+0.471
1.95%
jan 1, 1990
24.272
-0.356
-1.45%
jan 1, 1991
23.955
-0.317
-1.31%
jan 1, 1992
24.14
+0.185
0.77%
jan 1, 1993
24.089
-0.05
-0.21%
jan 1, 1994
25.212
+1.122
4.66%
jan 1, 1995
24.335
-0.877
-3.48%
jan 1, 1996
24.052
-0.283
-1.16%
jan 1, 1997
24.105
+0.053
0.22%
jan 1, 1998
23.639
-0.466
-1.93%
jan 1, 1999
24.129
+0.49
2.07%
jan 1, 2000
24.366
+0.237
0.98%
jan 1, 2001
23.874
-0.492
-2.02%
jan 1, 2002
24.325
+0.451
1.89%
jan 1, 2003
24.869
+0.544
2.24%
jan 1, 2004
25.038
+0.169
0.68%
jan 1, 2005
24.947
-0.091
-0.36%
jan 1, 2006
24.49
-0.457
-1.83%
jan 1, 2007
24.197
-0.293
-1.2%
jan 1, 2008
24.332
+0.135
0.56%
jan 1, 2009
25.156
+0.824
3.38%
jan 1, 2010
28.064
+2.909
11.56%
jan 1, 2011
27.553
-0.512
-1.82%
jan 1, 2012
26.76
-0.793
-2.88%
jan 1, 2013
26.646
-0.114
-0.43%
jan 1, 2014
26.471
-0.175
-0.66%
jan 1, 2015
26.34
-0.13
-0.49%
jan 1, 2016
26.129
-0.211
-0.8%
Ranking of countries by current statistics by years


Comments: