29
/
en
AIzaSyAYiBZKx7MnpbEhh9jyipgxe19OcubqV5w
April 1, 2024
27294
East Asia & Pacific
EAS
false
2
1
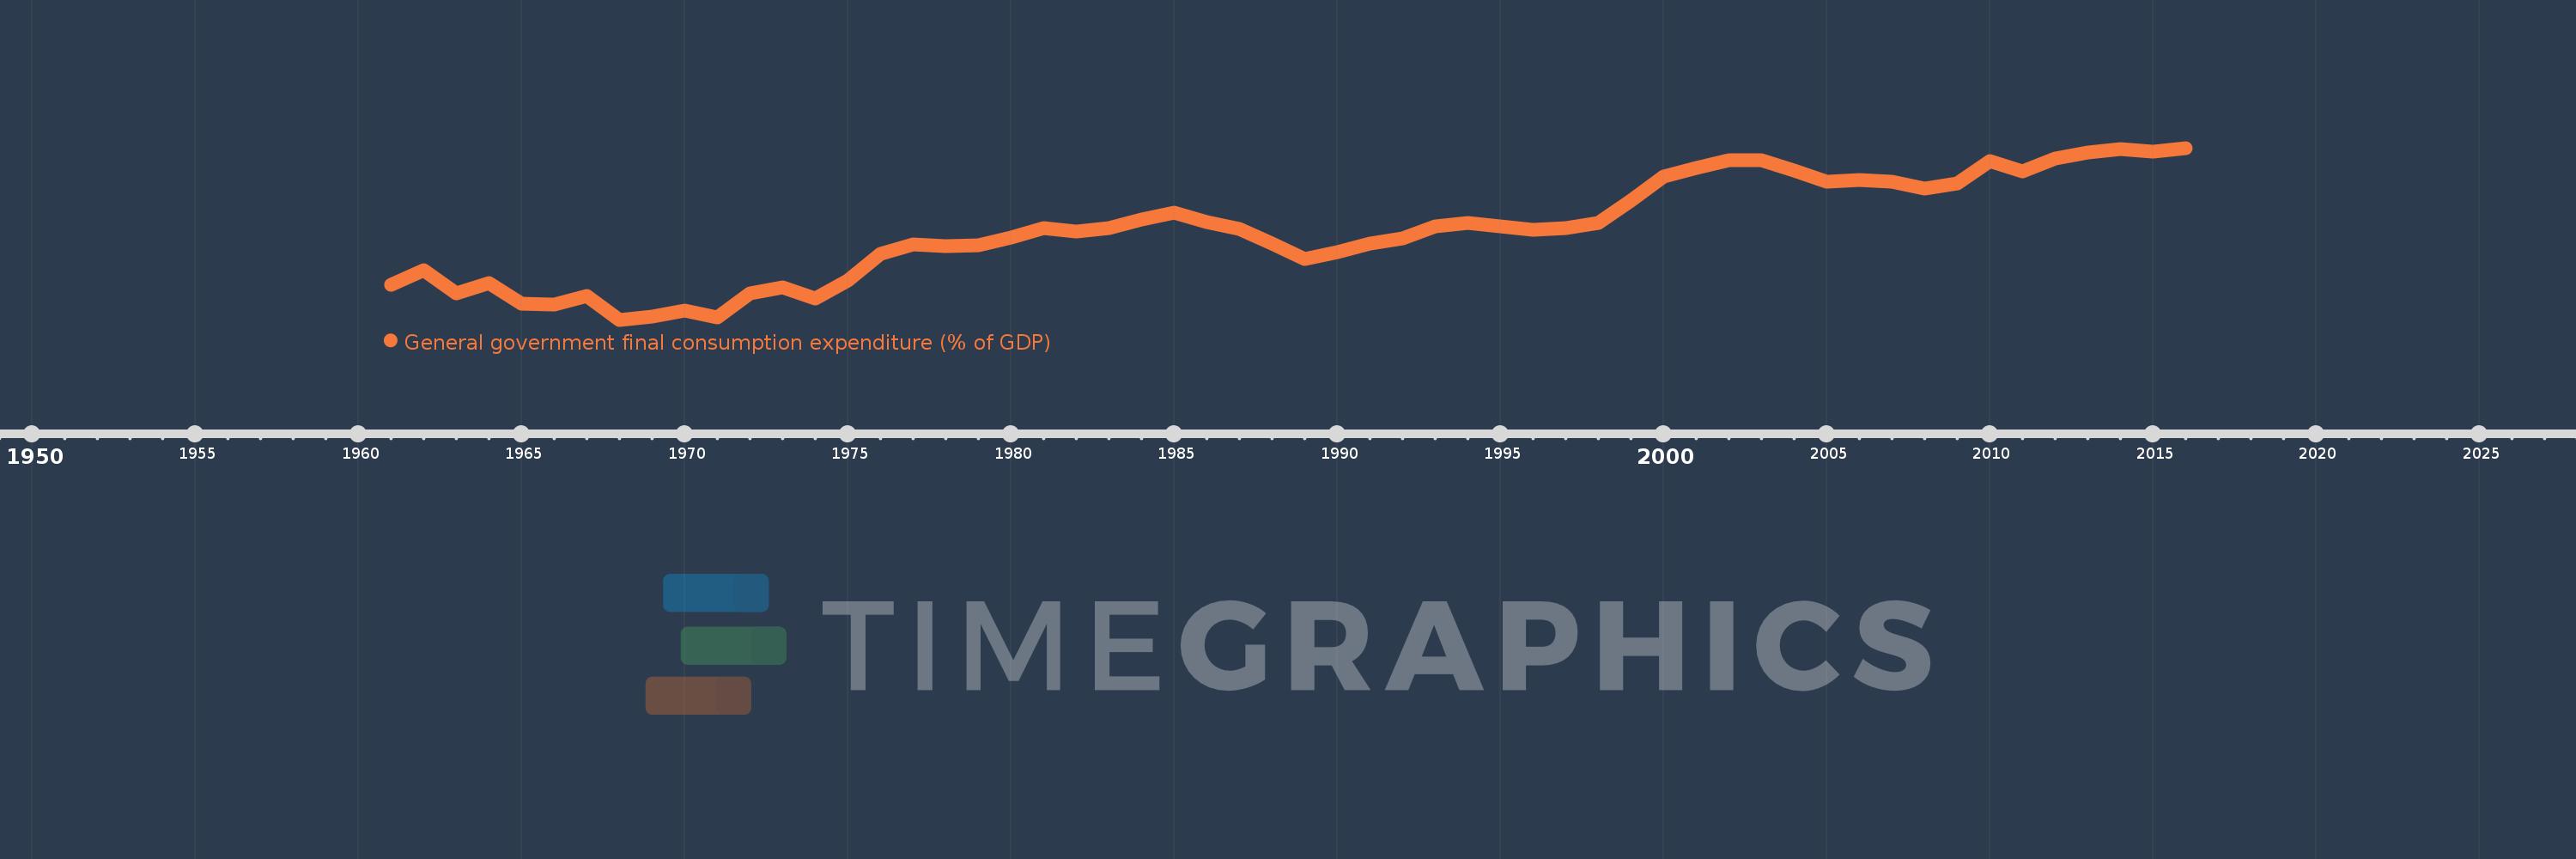
General government final consumption expenditure (% of GDP)
2016,2015,2014,2013,2012,2011,2010,2009,2008,2007,2006,2005,2004,2003,2002,2001,2000,1999,1998,1997,1996,1995,1994,1993,1992,1991,1990,1989,1988,1987,1986,1985,1984,1983,1982,1981,1980,1979,1978,1977,1976,1975,1974,1973,1972,1971,1970,1969,1968,1967,1966,1965,1964,1963,1962,1961
This statistics in other country:
AfghanistanAlbaniaAlgeriaAngolaAntigua and BarbudaArab WorldArgentinaArmeniaArubaAustraliaAustriaAzerbaijanBahamas, TheBahrainBangladeshBarbadosBelarusBelgiumBelizeBeninBermudaBhutanBoliviaBosnia and HerzegovinaBotswanaBrazilBrunei DarussalamBulgariaBurkina FasoBurundiCabo VerdeCambodiaCameroonCanadaCaribbean small statesCentral African RepublicCentral Europe and the BalticsChadChileChinaColombiaComorosCongo, Dem. Rep.Congo, Rep.Costa RicaCote d'IvoireCroatiaCubaCyprusCzech RepublicDenmarkDjiboutiDominicaDominican RepublicEarly-demographic dividendEast Asia & PacificEast Asia & Pacific (excluding high income)East Asia & Pacific (IDA & IBRD countries)EcuadorEgypt, Arab Rep.El SalvadorEquatorial GuineaEritreaEstoniaEthiopiaEuro areaEurope & Central AsiaEurope & Central Asia (excluding high income)Europe & Central Asia (IDA & IBRD countries)European UnionFaroe IslandsFijiFinlandFragile and conflict affected situationsFranceFrench PolynesiaGabonGambia, TheGeorgiaGermanyGhanaGreeceGrenadaGuatemalaGuineaGuinea-BissauGuyanaHaitiHeavily indebted poor countries (HIPC)High incomeHondurasHong Kong SAR, ChinaHungaryIBRD onlyIcelandIDA & IBRD totalIDA blendIDA onlyIDA totalIndiaIndonesiaIran, Islamic Rep.IraqIrelandIsraelItalyJamaicaJapanJordanKazakhstanKenyaKiribatiKorea, Rep.KosovoKuwaitKyrgyz RepublicLao PDRLate-demographic dividendLatin America & Caribbean Latin America & Caribbean (excluding high income)Latin America & the Caribbean (IDA & IBRD countries)LatviaLeast developed countries: UN classificationLebanonLesothoLiberiaLibyaLithuaniaLow & middle incomeLow incomeLower middle incomeLuxembourgMacao SAR, ChinaMacedonia, FYRMadagascarMalawiMalaysiaMaldivesMaliMaltaMauritaniaMauritiusMexicoMicronesia, Fed. Sts.Middle East & North AfricaMiddle East & North Africa (excluding high income)Middle East & North Africa (IDA & IBRD countries)Middle incomeMoldovaMongoliaMontenegroMoroccoMozambiqueNamibiaNepalNetherlandsNew CaledoniaNew ZealandNicaraguaNigerNigeriaNorth AmericaNorwayOECD membersOmanOther small statesPacific island small statesPakistanPanamaPapua New GuineaParaguayPeruPhilippinesPolandPortugalPost-demographic dividendPre-demographic dividendPuerto RicoQatarRomaniaRussian FederationRwandaSaudi ArabiaSenegalSerbiaSeychellesSierra LeoneSingaporeSlovak RepublicSloveniaSmall statesSolomon IslandsSomaliaSouth AfricaSouth AsiaSouth Asia (IDA & IBRD)South SudanSpainSri LankaSt. Kitts and NevisSt. LuciaSt. Vincent and the GrenadinesSub-Saharan Africa Sub-Saharan Africa (excluding high income)Sub-Saharan Africa (IDA & IBRD countries)SudanSurinameSwazilandSwedenSwitzerlandSyrian Arab RepublicTajikistanTanzaniaThailandTimor-LesteTogoTongaTrinidad and TobagoTunisiaTurkeyTurkmenistanUgandaUkraineUnited Arab EmiratesUnited KingdomUnited StatesUpper middle incomeUruguayUzbekistanVanuatuVenezuela, RBVietnamWest Bank and GazaWorldYemen, Rep.ZambiaZimbabwe Timeline:
This timeline shows a graph from 1961 to 2016 of East Asia & Pacific. No data until 1960. Number of actual observations by date: 56.
Source name:
World Development Indicators
Source organization:
World Bank national accounts data, and OECD National Accounts data files.
Categories, topics:
Economy & Growth
Last updated:
apr 23, 2017
Indicators value changes by year
Minimum:
11.003
jan 1, 1968
Maximum:
16.126
jan 1, 2016
At the date of observation
Value
Absolute change
Change from previous value
jan 1, 1961
12.058
+12.058
0.0%
jan 1, 1962
12.473
+0.415
3.44%
jan 1, 1963
11.785
-0.688
-5.52%
jan 1, 1964
12.09
+0.305
2.59%
jan 1, 1965
11.484
-0.606
-5.01%
jan 1, 1966
11.46
-0.024
-0.21%
jan 1, 1967
11.712
+0.251
2.19%
jan 1, 1968
11.003
-0.709
-6.05%
jan 1, 1969
11.095
+0.092
0.83%
jan 1, 1970
11.277
+0.182
1.64%
jan 1, 1971
11.077
-0.2
-1.77%
jan 1, 1972
11.777
+0.699
6.31%
jan 1, 1973
11.957
+0.18
1.53%
jan 1, 1974
11.646
-0.311
-2.6%
jan 1, 1975
12.177
+0.531
4.56%
jan 1, 1976
12.976
+0.799
6.56%
jan 1, 1977
13.251
+0.275
2.12%
jan 1, 1978
13.209
-0.042
-0.32%
jan 1, 1979
13.224
+0.015
0.11%
jan 1, 1980
13.447
+0.223
1.69%
jan 1, 1981
13.725
+0.277
2.06%
jan 1, 1982
13.63
-0.095
-0.69%
jan 1, 1983
13.734
+0.104
0.77%
jan 1, 1984
14.0
+0.266
1.93%
jan 1, 1985
14.202
+0.202
1.45%
jan 1, 1986
13.92
-0.283
-1.99%
jan 1, 1987
13.711
-0.209
-1.5%
jan 1, 1988
13.273
-0.438
-3.2%
jan 1, 1989
12.807
-0.466
-3.51%
jan 1, 1990
13.024
+0.218
1.7%
jan 1, 1991
13.264
+0.24
1.84%
jan 1, 1992
13.436
+0.172
1.3%
jan 1, 1993
13.788
+0.352
2.62%
jan 1, 1994
13.881
+0.093
0.67%
jan 1, 1995
13.792
-0.089
-0.64%
jan 1, 1996
13.675
-0.117
-0.85%
jan 1, 1997
13.743
+0.068
0.5%
jan 1, 1998
13.894
+0.151
1.1%
jan 1, 1999
14.566
+0.672
4.84%
jan 1, 2000
15.271
+0.705
4.84%
jan 1, 2001
15.539
+0.268
1.75%
jan 1, 2002
15.764
+0.226
1.45%
jan 1, 2003
15.772
+0.007
0.05%
jan 1, 2004
15.462
-0.31
-1.96%
jan 1, 2005
15.114
-0.348
-2.25%
jan 1, 2006
15.171
+0.057
0.38%
jan 1, 2007
15.117
-0.054
-0.36%
jan 1, 2008
14.92
-0.196
-1.3%
jan 1, 2009
15.066
+0.146
0.98%
jan 1, 2010
15.74
+0.674
4.47%
jan 1, 2011
15.438
-0.302
-1.92%
jan 1, 2012
15.8
+0.361
2.34%
jan 1, 2013
15.987
+0.187
1.18%
jan 1, 2014
16.094
+0.107
0.67%
jan 1, 2015
16.016
-0.078
-0.48%
jan 1, 2016
16.126
+0.11
0.69%
Ranking of countries by current statistics by years


Comments: