29
/
en
AIzaSyAYiBZKx7MnpbEhh9jyipgxe19OcubqV5w
April 1, 2024
216434
Pakistan
PAK
true
2
1
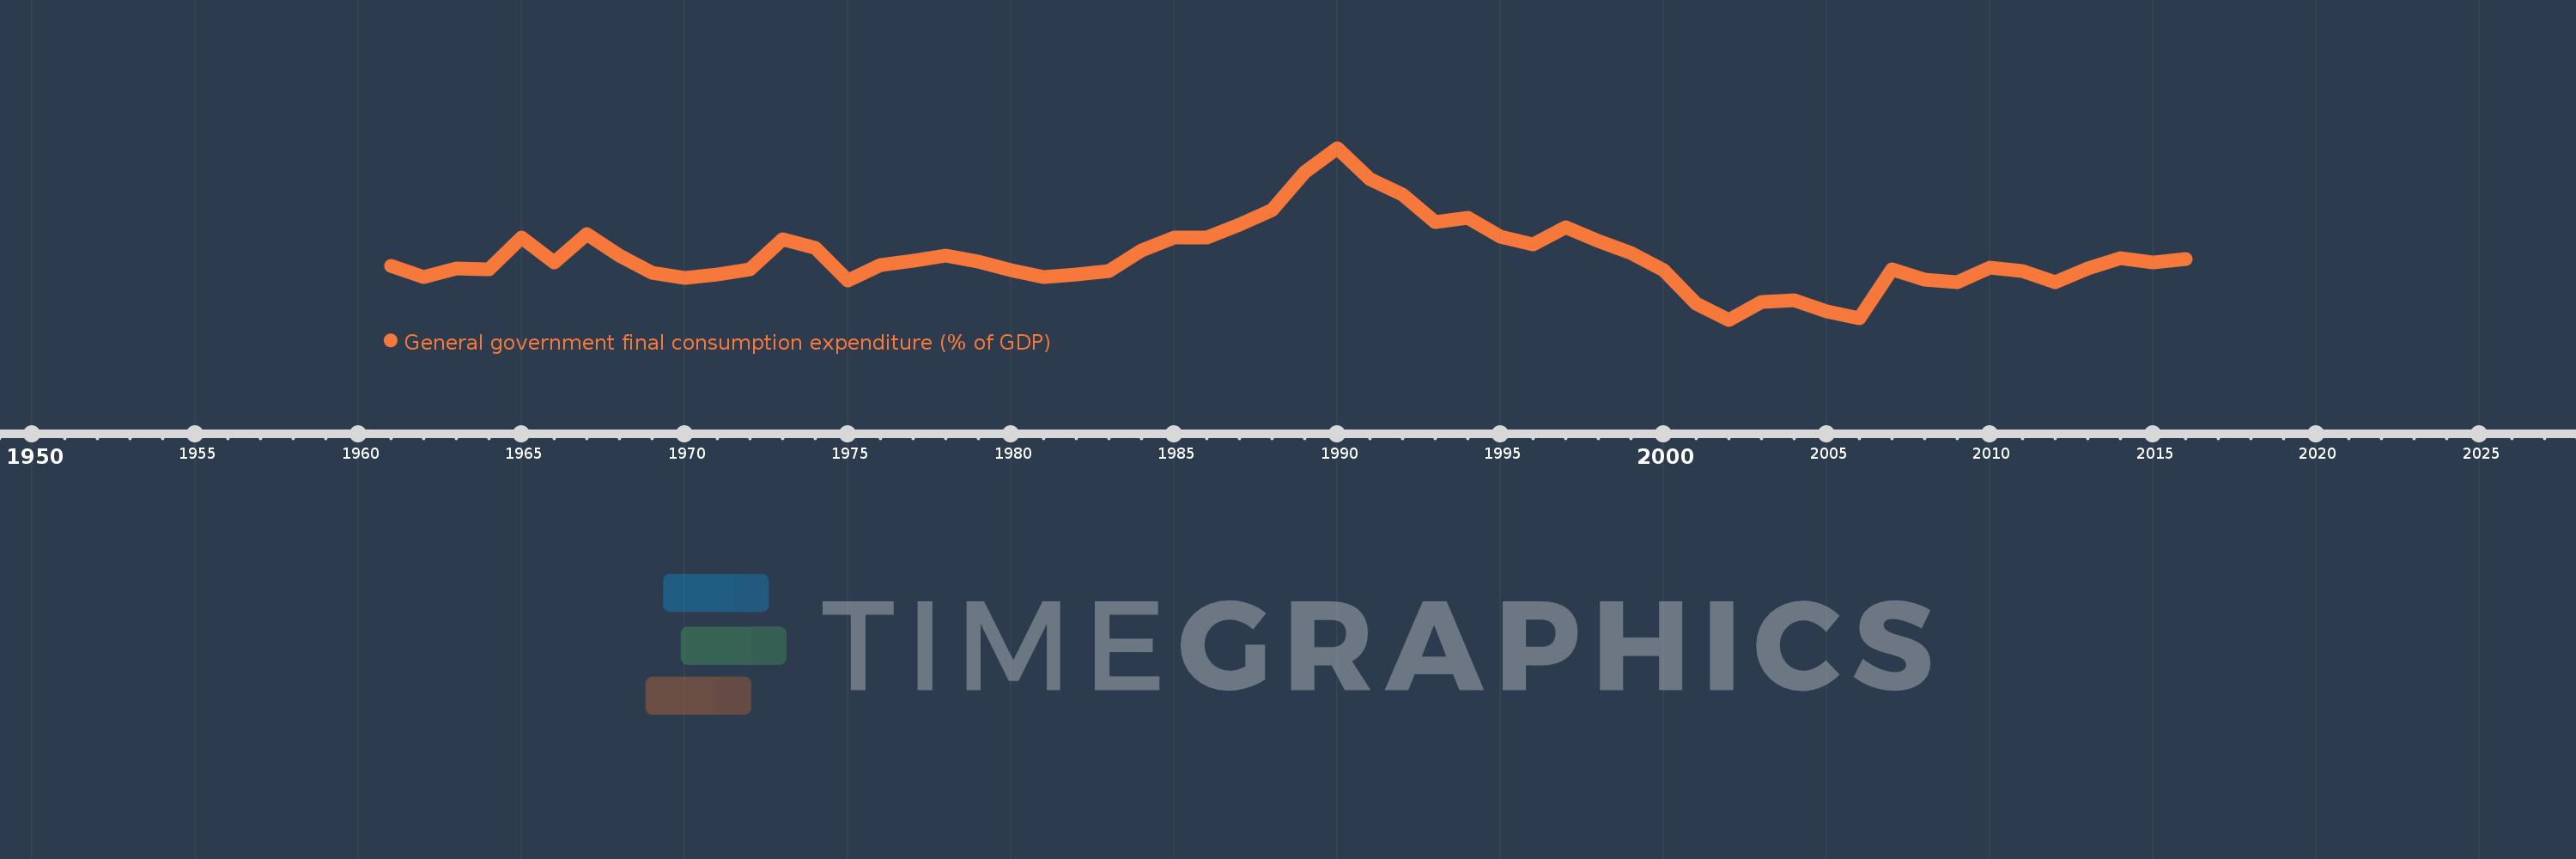
General government final consumption expenditure (% of GDP)
2016,2015,2014,2013,2012,2011,2010,2009,2008,2007,2006,2005,2004,2003,2002,2001,2000,1999,1998,1997,1996,1995,1994,1993,1992,1991,1990,1989,1988,1987,1986,1985,1984,1983,1982,1981,1980,1979,1978,1977,1976,1975,1974,1973,1972,1971,1970,1969,1968,1967,1966,1965,1964,1963,1962,1961
This statistics in other country:
AfghanistanAlbaniaAlgeriaAngolaAntigua and BarbudaArab WorldArgentinaArmeniaArubaAustraliaAustriaAzerbaijanBahamas, TheBahrainBangladeshBarbadosBelarusBelgiumBelizeBeninBermudaBhutanBoliviaBosnia and HerzegovinaBotswanaBrazilBrunei DarussalamBulgariaBurkina FasoBurundiCabo VerdeCambodiaCameroonCanadaCaribbean small statesCentral African RepublicCentral Europe and the BalticsChadChileChinaColombiaComorosCongo, Dem. Rep.Congo, Rep.Costa RicaCote d'IvoireCroatiaCubaCyprusCzech RepublicDenmarkDjiboutiDominicaDominican RepublicEarly-demographic dividendEast Asia & PacificEast Asia & Pacific (excluding high income)East Asia & Pacific (IDA & IBRD countries)EcuadorEgypt, Arab Rep.El SalvadorEquatorial GuineaEritreaEstoniaEthiopiaEuro areaEurope & Central AsiaEurope & Central Asia (excluding high income)Europe & Central Asia (IDA & IBRD countries)European UnionFaroe IslandsFijiFinlandFragile and conflict affected situationsFranceFrench PolynesiaGabonGambia, TheGeorgiaGermanyGhanaGreeceGrenadaGuatemalaGuineaGuinea-BissauGuyanaHaitiHeavily indebted poor countries (HIPC)High incomeHondurasHong Kong SAR, ChinaHungaryIBRD onlyIcelandIDA & IBRD totalIDA blendIDA onlyIDA totalIndiaIndonesiaIran, Islamic Rep.IraqIrelandIsraelItalyJamaicaJapanJordanKazakhstanKenyaKiribatiKorea, Rep.KosovoKuwaitKyrgyz RepublicLao PDRLate-demographic dividendLatin America & Caribbean Latin America & Caribbean (excluding high income)Latin America & the Caribbean (IDA & IBRD countries)LatviaLeast developed countries: UN classificationLebanonLesothoLiberiaLibyaLithuaniaLow & middle incomeLow incomeLower middle incomeLuxembourgMacao SAR, ChinaMacedonia, FYRMadagascarMalawiMalaysiaMaldivesMaliMaltaMauritaniaMauritiusMexicoMicronesia, Fed. Sts.Middle East & North AfricaMiddle East & North Africa (excluding high income)Middle East & North Africa (IDA & IBRD countries)Middle incomeMoldovaMongoliaMontenegroMoroccoMozambiqueNamibiaNepalNetherlandsNew CaledoniaNew ZealandNicaraguaNigerNigeriaNorth AmericaNorwayOECD membersOmanOther small statesPacific island small statesPakistanPanamaPapua New GuineaParaguayPeruPhilippinesPolandPortugalPost-demographic dividendPre-demographic dividendPuerto RicoQatarRomaniaRussian FederationRwandaSaudi ArabiaSenegalSerbiaSeychellesSierra LeoneSingaporeSlovak RepublicSloveniaSmall statesSolomon IslandsSomaliaSouth AfricaSouth AsiaSouth Asia (IDA & IBRD)South SudanSpainSri LankaSt. Kitts and NevisSt. LuciaSt. Vincent and the GrenadinesSub-Saharan Africa Sub-Saharan Africa (excluding high income)Sub-Saharan Africa (IDA & IBRD countries)SudanSurinameSwazilandSwedenSwitzerlandSyrian Arab RepublicTajikistanTanzaniaThailandTimor-LesteTogoTongaTrinidad and TobagoTunisiaTurkeyTurkmenistanUgandaUkraineUnited Arab EmiratesUnited KingdomUnited StatesUpper middle incomeUruguayUzbekistanVanuatuVenezuela, RBVietnamWest Bank and GazaWorldYemen, Rep.ZambiaZimbabwe Timeline:
This timeline shows a graph from 1961 to 2016 of Pakistan. No data until 1960. Number of actual observations by date: 56.
Source name:
World Development Indicators
Source organization:
World Bank national accounts data, and OECD National Accounts data files.
Categories, topics:
Economy & Growth
Last updated:
apr 23, 2017
Indicators value changes by year
Maximum:
16.785
jan 1, 1990
At the date of observation
Value
Absolute change
Change from previous value
jan 1, 1961
10.587
+10.587
0.0%
jan 1, 1962
10.037
-0.55
-5.2%
jan 1, 1963
10.447
+0.41
4.09%
jan 1, 1964
10.406
-0.041
-0.4%
jan 1, 1965
12.075
+1.669
16.04%
jan 1, 1966
10.766
-1.309
-10.84%
jan 1, 1967
12.288
+1.522
14.14%
jan 1, 1968
11.147
-1.141
-9.29%
jan 1, 1969
10.225
-0.922
-8.27%
jan 1, 1970
9.978
-0.246
-2.41%
jan 1, 1971
10.149
+0.171
1.71%
jan 1, 1972
10.438
+0.289
2.85%
jan 1, 1973
11.983
+1.545
14.8%
jan 1, 1974
11.55
-0.433
-3.61%
jan 1, 1975
9.832
-1.719
-14.88%
jan 1, 1976
10.644
+0.813
8.27%
jan 1, 1977
10.862
+0.217
2.04%
jan 1, 1978
11.161
+0.3
2.76%
jan 1, 1979
10.836
-0.326
-2.92%
jan 1, 1980
10.373
-0.462
-4.27%
jan 1, 1981
10.035
-0.338
-3.26%
jan 1, 1982
10.164
+0.129
1.29%
jan 1, 1983
10.341
+0.177
1.74%
jan 1, 1984
11.418
+1.077
10.41%
jan 1, 1985
12.087
+0.669
5.86%
jan 1, 1986
12.099
+0.012
0.1%
jan 1, 1987
12.761
+0.663
5.48%
jan 1, 1988
13.534
+0.773
6.06%
jan 1, 1989
15.51
+1.976
14.6%
jan 1, 1990
16.785
+1.275
8.22%
jan 1, 1991
15.137
-1.648
-9.82%
jan 1, 1992
14.318
-0.819
-5.41%
jan 1, 1993
12.908
-1.41
-9.85%
jan 1, 1994
13.104
+0.196
1.52%
jan 1, 1995
12.113
-0.991
-7.56%
jan 1, 1996
11.744
-0.37
-3.05%
jan 1, 1997
12.645
+0.902
7.68%
jan 1, 1998
11.894
-0.752
-5.94%
jan 1, 1999
11.264
-0.629
-5.29%
jan 1, 2000
10.36
-0.904
-8.03%
jan 1, 2001
8.643
-1.717
-16.57%
jan 1, 2002
7.781
-0.862
-9.98%
jan 1, 2003
8.724
+0.943
12.12%
jan 1, 2004
8.792
+0.069
0.79%
jan 1, 2005
8.199
-0.594
-6.75%
jan 1, 2006
7.844
-0.355
-4.32%
jan 1, 2007
10.436
+2.592
33.04%
jan 1, 2008
9.874
-0.562
-5.39%
jan 1, 2009
9.75
-0.124
-1.26%
jan 1, 2010
10.519
+0.769
7.89%
jan 1, 2011
10.316
-0.203
-1.93%
jan 1, 2012
9.736
-0.58
-5.62%
jan 1, 2013
10.489
+0.753
7.73%
jan 1, 2014
11.003
+0.514
4.9%
jan 1, 2015
10.763
-0.24
-2.18%
jan 1, 2016
10.953
+0.19
1.76%
Ranking of countries by current statistics by years


Comments: