29
/
en
AIzaSyAYiBZKx7MnpbEhh9jyipgxe19OcubqV5w
April 1, 2024
127356
Equatorial Guinea
GNQ
true
2
1
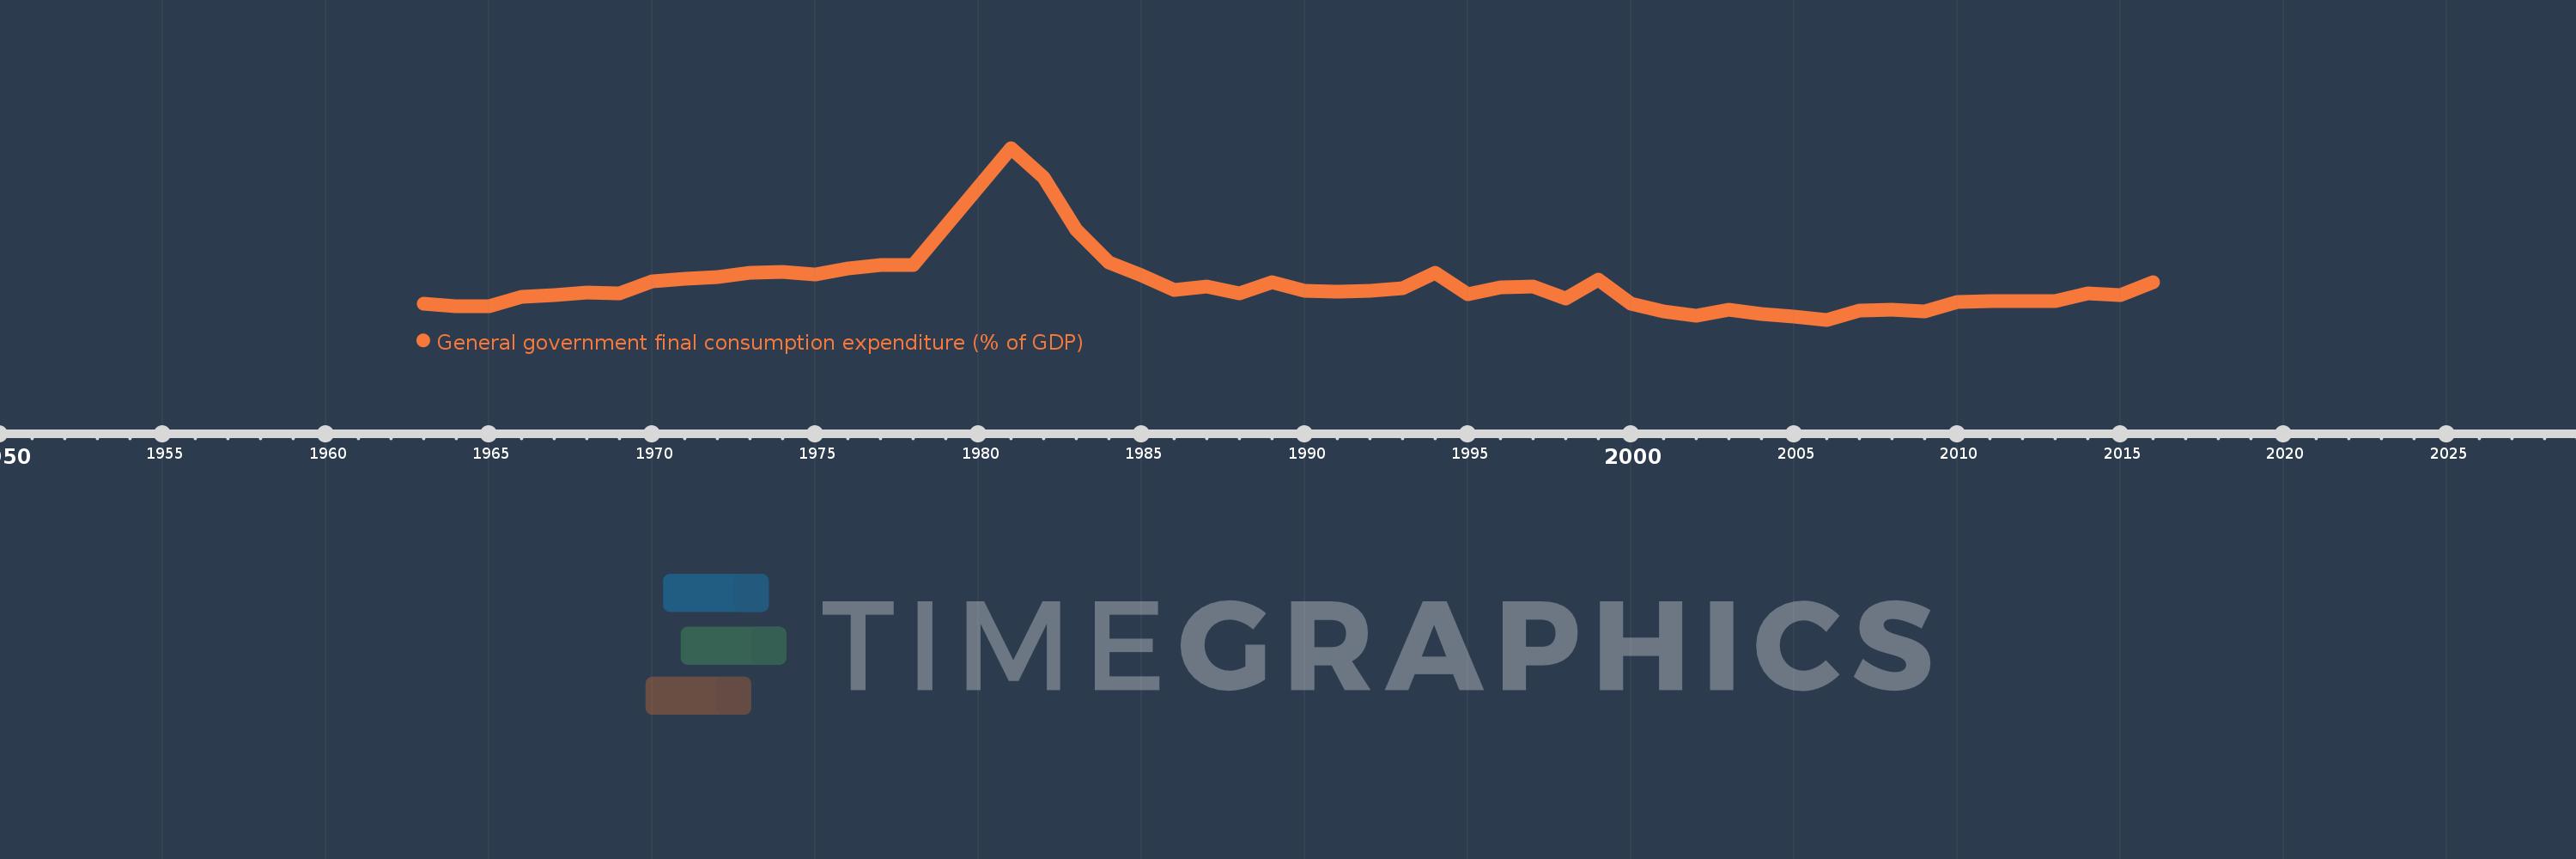
General government final consumption expenditure (% of GDP)
2016,2015,2014,2013,2012,2011,2010,2009,2008,2007,2006,2005,2004,2003,2002,2001,2000,1999,1998,1997,1996,1995,1994,1993,1992,1991,1990,1989,1988,1987,1986,1985,1984,1983,1982,1981,1978,1977,1976,1975,1974,1973,1972,1971,1970,1969,1968,1967,1966,1965,1964,1963
This statistics in other country:
AfghanistanAlbaniaAlgeriaAngolaAntigua and BarbudaArab WorldArgentinaArmeniaArubaAustraliaAustriaAzerbaijanBahamas, TheBahrainBangladeshBarbadosBelarusBelgiumBelizeBeninBermudaBhutanBoliviaBosnia and HerzegovinaBotswanaBrazilBrunei DarussalamBulgariaBurkina FasoBurundiCabo VerdeCambodiaCameroonCanadaCaribbean small statesCentral African RepublicCentral Europe and the BalticsChadChileChinaColombiaComorosCongo, Dem. Rep.Congo, Rep.Costa RicaCote d'IvoireCroatiaCubaCyprusCzech RepublicDenmarkDjiboutiDominicaDominican RepublicEarly-demographic dividendEast Asia & PacificEast Asia & Pacific (excluding high income)East Asia & Pacific (IDA & IBRD countries)EcuadorEgypt, Arab Rep.El SalvadorEquatorial GuineaEritreaEstoniaEthiopiaEuro areaEurope & Central AsiaEurope & Central Asia (excluding high income)Europe & Central Asia (IDA & IBRD countries)European UnionFaroe IslandsFijiFinlandFragile and conflict affected situationsFranceFrench PolynesiaGabonGambia, TheGeorgiaGermanyGhanaGreeceGrenadaGuatemalaGuineaGuinea-BissauGuyanaHaitiHeavily indebted poor countries (HIPC)High incomeHondurasHong Kong SAR, ChinaHungaryIBRD onlyIcelandIDA & IBRD totalIDA blendIDA onlyIDA totalIndiaIndonesiaIran, Islamic Rep.IraqIrelandIsraelItalyJamaicaJapanJordanKazakhstanKenyaKiribatiKorea, Rep.KosovoKuwaitKyrgyz RepublicLao PDRLate-demographic dividendLatin America & Caribbean Latin America & Caribbean (excluding high income)Latin America & the Caribbean (IDA & IBRD countries)LatviaLeast developed countries: UN classificationLebanonLesothoLiberiaLibyaLithuaniaLow & middle incomeLow incomeLower middle incomeLuxembourgMacao SAR, ChinaMacedonia, FYRMadagascarMalawiMalaysiaMaldivesMaliMaltaMauritaniaMauritiusMexicoMicronesia, Fed. Sts.Middle East & North AfricaMiddle East & North Africa (excluding high income)Middle East & North Africa (IDA & IBRD countries)Middle incomeMoldovaMongoliaMontenegroMoroccoMozambiqueNamibiaNepalNetherlandsNew CaledoniaNew ZealandNicaraguaNigerNigeriaNorth AmericaNorwayOECD membersOmanOther small statesPacific island small statesPakistanPanamaPapua New GuineaParaguayPeruPhilippinesPolandPortugalPost-demographic dividendPre-demographic dividendPuerto RicoQatarRomaniaRussian FederationRwandaSaudi ArabiaSenegalSerbiaSeychellesSierra LeoneSingaporeSlovak RepublicSloveniaSmall statesSolomon IslandsSomaliaSouth AfricaSouth AsiaSouth Asia (IDA & IBRD)South SudanSpainSri LankaSt. Kitts and NevisSt. LuciaSt. Vincent and the GrenadinesSub-Saharan Africa Sub-Saharan Africa (excluding high income)Sub-Saharan Africa (IDA & IBRD countries)SudanSurinameSwazilandSwedenSwitzerlandSyrian Arab RepublicTajikistanTanzaniaThailandTimor-LesteTogoTongaTrinidad and TobagoTunisiaTurkeyTurkmenistanUgandaUkraineUnited Arab EmiratesUnited KingdomUnited StatesUpper middle incomeUruguayUzbekistanVanuatuVenezuela, RBVietnamWest Bank and GazaWorldYemen, Rep.ZambiaZimbabwe Timeline:
This timeline shows a graph from 1963 to 2016 of Equatorial Guinea. No data until 1962. Number of actual observations by date: 52.
Source name:
World Development Indicators
Source organization:
World Bank national accounts data, and OECD National Accounts data files.
Categories, topics:
Economy & Growth
Last updated:
apr 23, 2017
Indicators value changes by year
Maximum:
84.508
jan 1, 1981
At the date of observation
Value
Absolute change
Change from previous value
jan 1, 1963
10.514
+10.514
0.0%
jan 1, 1964
8.961
-1.553
-14.77%
jan 1, 1965
9.246
+0.285
3.18%
jan 1, 1966
13.488
+4.242
45.88%
jan 1, 1967
14.277
+0.789
5.85%
jan 1, 1968
15.764
+1.487
10.42%
jan 1, 1969
15.108
-0.656
-4.16%
jan 1, 1970
20.825
+5.717
37.84%
jan 1, 1971
22.205
+1.379
6.62%
jan 1, 1972
22.94
+0.735
3.31%
jan 1, 1973
25.04
+2.101
9.16%
jan 1, 1974
25.378
+0.337
1.35%
jan 1, 1975
24.237
-1.141
-4.5%
jan 1, 1976
27.258
+3.021
12.46%
jan 1, 1977
28.67
+1.413
5.18%
jan 1, 1978
28.873
+0.203
0.71%
jan 1, 1981
84.508
+55.635
192.69%
jan 1, 1982
70.378
-14.131
-16.72%
jan 1, 1983
45.63
-24.748
-35.16%
jan 1, 1984
30.123
-15.507
-33.98%
jan 1, 1985
24.042
-6.08
-20.19%
jan 1, 1986
16.887
-7.156
-29.76%
jan 1, 1987
18.682
+1.796
10.63%
jan 1, 1988
15.107
-3.576
-19.14%
jan 1, 1989
20.507
+5.4
35.74%
jan 1, 1990
16.55
-3.956
-19.29%
jan 1, 1991
16.28
-0.27
-1.63%
jan 1, 1992
16.694
+0.414
2.54%
jan 1, 1993
17.832
+1.138
6.81%
jan 1, 1994
24.928
+7.096
39.8%
jan 1, 1995
14.888
-10.04
-40.28%
jan 1, 1996
18.303
+3.416
22.94%
jan 1, 1997
18.456
+0.152
0.83%
jan 1, 1998
12.937
-5.519
-29.9%
jan 1, 1999
21.734
+8.797
68.0%
jan 1, 2000
10.212
-11.522
-53.01%
jan 1, 2001
6.58
-3.632
-35.57%
jan 1, 2002
4.642
-1.937
-29.45%
jan 1, 2003
7.334
+2.692
57.99%
jan 1, 2004
5.408
-1.927
-26.27%
jan 1, 2005
4.193
-1.215
-22.46%
jan 1, 2006
2.736
-1.457
-34.74%
jan 1, 2007
7.272
+4.536
165.79%
jan 1, 2008
7.658
+0.386
5.31%
jan 1, 2009
6.654
-1.005
-13.12%
jan 1, 2010
11.134
+4.481
67.34%
jan 1, 2011
11.686
+0.552
4.96%
jan 1, 2012
11.781
+0.095
0.81%
jan 1, 2013
11.582
-0.199
-1.69%
jan 1, 2014
15.458
+3.876
33.47%
jan 1, 2015
14.424
-1.034
-6.69%
jan 1, 2016
20.58
+6.156
42.68%
Ranking of countries by current statistics by years


Comments: