29
/
en
AIzaSyAYiBZKx7MnpbEhh9jyipgxe19OcubqV5w
April 1, 2024
201580
Morocco
MAR
true
2
1
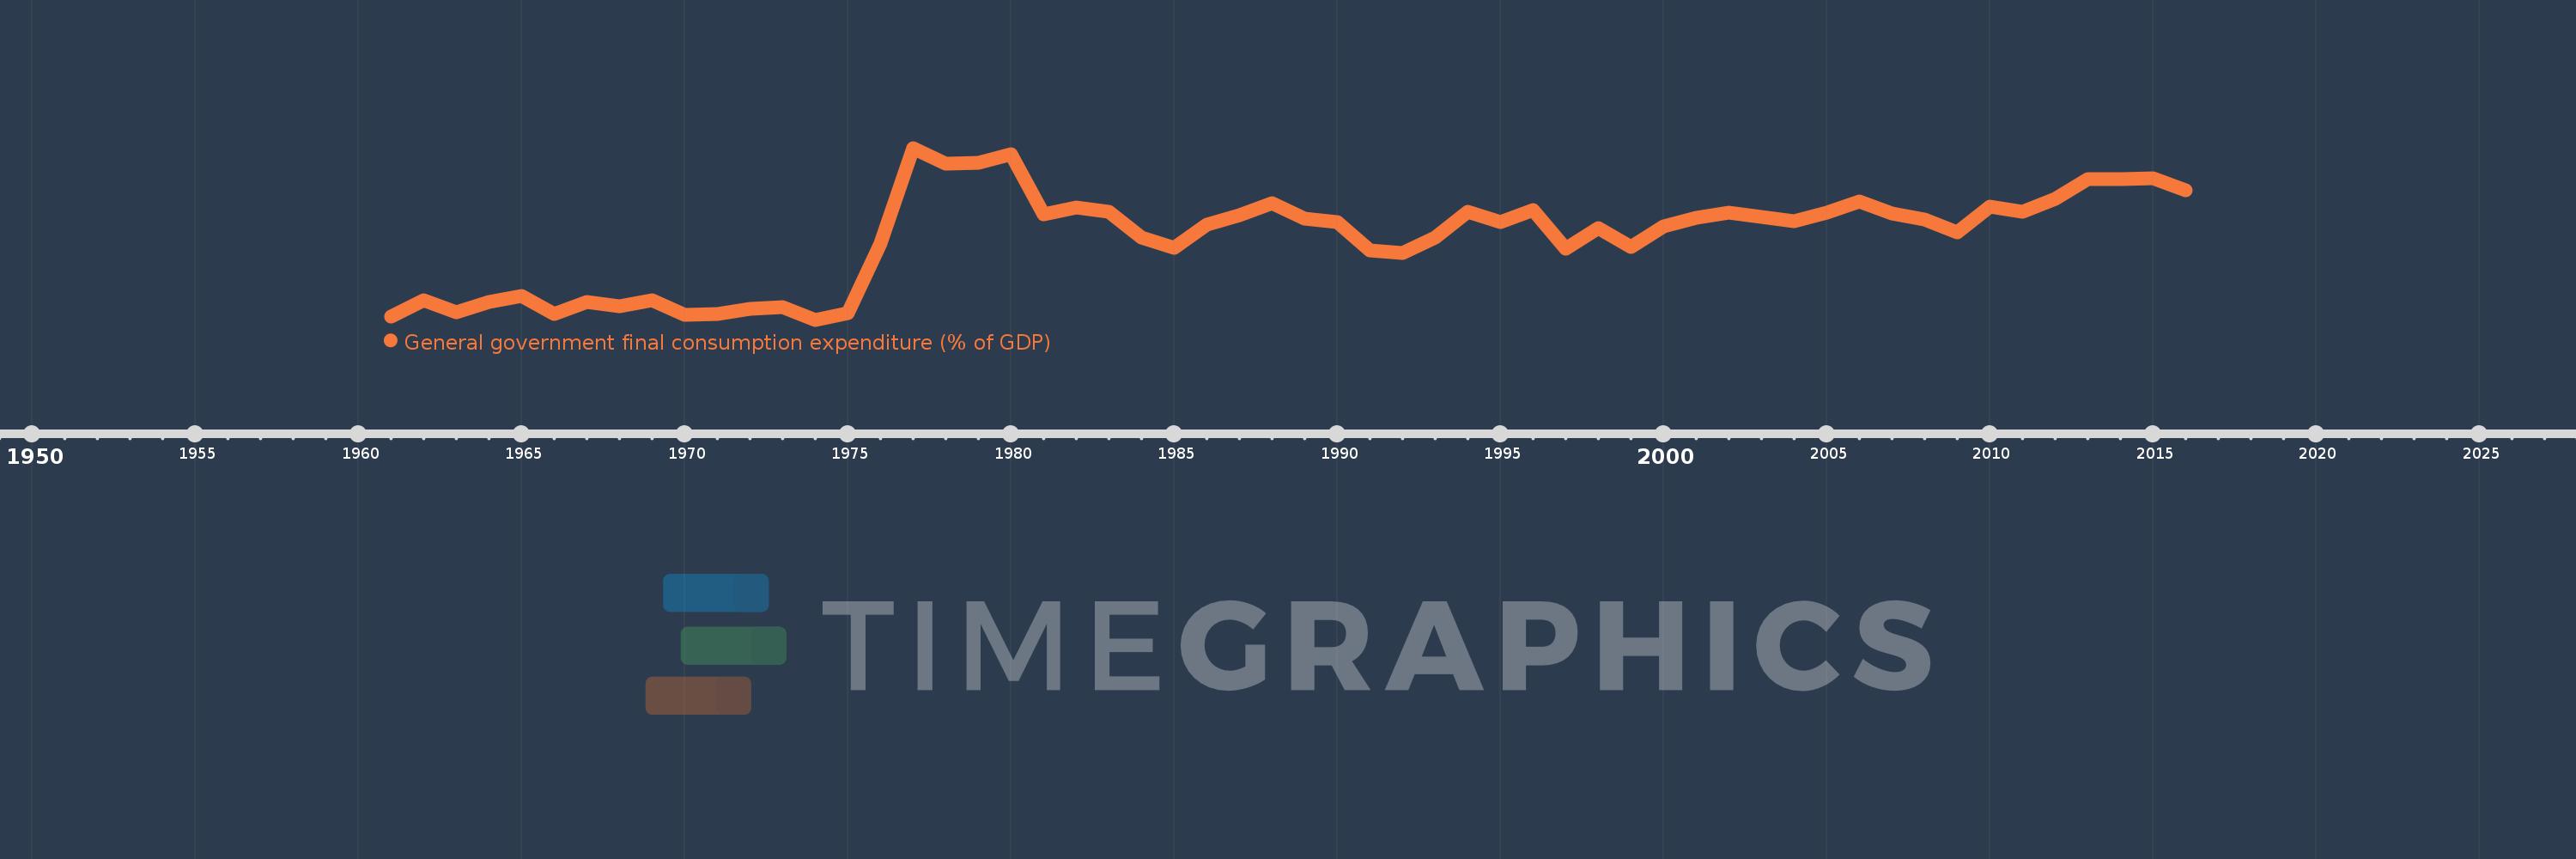
General government final consumption expenditure (% of GDP)
2016,2015,2014,2013,2012,2011,2010,2009,2008,2007,2006,2005,2004,2003,2002,2001,2000,1999,1998,1997,1996,1995,1994,1993,1992,1991,1990,1989,1988,1987,1986,1985,1984,1983,1982,1981,1980,1979,1978,1977,1976,1975,1974,1973,1972,1971,1970,1969,1968,1967,1966,1965,1964,1963,1962,1961
This statistics in other country:
AfghanistanAlbaniaAlgeriaAngolaAntigua and BarbudaArab WorldArgentinaArmeniaArubaAustraliaAustriaAzerbaijanBahamas, TheBahrainBangladeshBarbadosBelarusBelgiumBelizeBeninBermudaBhutanBoliviaBosnia and HerzegovinaBotswanaBrazilBrunei DarussalamBulgariaBurkina FasoBurundiCabo VerdeCambodiaCameroonCanadaCaribbean small statesCentral African RepublicCentral Europe and the BalticsChadChileChinaColombiaComorosCongo, Dem. Rep.Congo, Rep.Costa RicaCote d'IvoireCroatiaCubaCyprusCzech RepublicDenmarkDjiboutiDominicaDominican RepublicEarly-demographic dividendEast Asia & PacificEast Asia & Pacific (excluding high income)East Asia & Pacific (IDA & IBRD countries)EcuadorEgypt, Arab Rep.El SalvadorEquatorial GuineaEritreaEstoniaEthiopiaEuro areaEurope & Central AsiaEurope & Central Asia (excluding high income)Europe & Central Asia (IDA & IBRD countries)European UnionFaroe IslandsFijiFinlandFragile and conflict affected situationsFranceFrench PolynesiaGabonGambia, TheGeorgiaGermanyGhanaGreeceGrenadaGuatemalaGuineaGuinea-BissauGuyanaHaitiHeavily indebted poor countries (HIPC)High incomeHondurasHong Kong SAR, ChinaHungaryIBRD onlyIcelandIDA & IBRD totalIDA blendIDA onlyIDA totalIndiaIndonesiaIran, Islamic Rep.IraqIrelandIsraelItalyJamaicaJapanJordanKazakhstanKenyaKiribatiKorea, Rep.KosovoKuwaitKyrgyz RepublicLao PDRLate-demographic dividendLatin America & Caribbean Latin America & Caribbean (excluding high income)Latin America & the Caribbean (IDA & IBRD countries)LatviaLeast developed countries: UN classificationLebanonLesothoLiberiaLibyaLithuaniaLow & middle incomeLow incomeLower middle incomeLuxembourgMacao SAR, ChinaMacedonia, FYRMadagascarMalawiMalaysiaMaldivesMaliMaltaMauritaniaMauritiusMexicoMicronesia, Fed. Sts.Middle East & North AfricaMiddle East & North Africa (excluding high income)Middle East & North Africa (IDA & IBRD countries)Middle incomeMoldovaMongoliaMontenegroMoroccoMozambiqueNamibiaNepalNetherlandsNew CaledoniaNew ZealandNicaraguaNigerNigeriaNorth AmericaNorwayOECD membersOmanOther small statesPacific island small statesPakistanPanamaPapua New GuineaParaguayPeruPhilippinesPolandPortugalPost-demographic dividendPre-demographic dividendPuerto RicoQatarRomaniaRussian FederationRwandaSaudi ArabiaSenegalSerbiaSeychellesSierra LeoneSingaporeSlovak RepublicSloveniaSmall statesSolomon IslandsSomaliaSouth AfricaSouth AsiaSouth Asia (IDA & IBRD)South SudanSpainSri LankaSt. Kitts and NevisSt. LuciaSt. Vincent and the GrenadinesSub-Saharan Africa Sub-Saharan Africa (excluding high income)Sub-Saharan Africa (IDA & IBRD countries)SudanSurinameSwazilandSwedenSwitzerlandSyrian Arab RepublicTajikistanTanzaniaThailandTimor-LesteTogoTongaTrinidad and TobagoTunisiaTurkeyTurkmenistanUgandaUkraineUnited Arab EmiratesUnited KingdomUnited StatesUpper middle incomeUruguayUzbekistanVanuatuVenezuela, RBVietnamWest Bank and GazaWorldYemen, Rep.ZambiaZimbabwe Timeline:
This timeline shows a graph from 1961 to 2016 of Morocco. No data until 1960. Number of actual observations by date: 56.
Source name:
World Development Indicators
Source organization:
World Bank national accounts data, and OECD National Accounts data files.
Categories, topics:
Economy & Growth
Last updated:
apr 23, 2017
Indicators value changes by year
Minimum:
11.667
jan 1, 1974
Maximum:
21.671
jan 1, 1977
At the date of observation
Value
Absolute change
Change from previous value
jan 1, 1961
11.834
+11.834
0.0%
jan 1, 1962
12.779
+0.945
7.98%
jan 1, 1963
12.124
-0.655
-5.13%
jan 1, 1964
12.717
+0.592
4.89%
jan 1, 1965
13.064
+0.347
2.73%
jan 1, 1966
11.997
-1.067
-8.17%
jan 1, 1967
12.71
+0.712
5.94%
jan 1, 1968
12.455
-0.255
-2.01%
jan 1, 1969
12.806
+0.351
2.82%
jan 1, 1970
11.949
-0.857
-6.69%
jan 1, 1971
12.022
+0.074
0.62%
jan 1, 1972
12.313
+0.291
2.42%
jan 1, 1973
12.384
+0.071
0.57%
jan 1, 1974
11.667
-0.717
-5.79%
jan 1, 1975
12.033
+0.366
3.14%
jan 1, 1976
16.091
+4.058
33.72%
jan 1, 1977
21.671
+5.58
34.68%
jan 1, 1978
20.755
-0.916
-4.23%
jan 1, 1979
20.795
+0.039
0.19%
jan 1, 1980
21.326
+0.531
2.55%
jan 1, 1981
17.825
-3.501
-16.42%
jan 1, 1982
18.225
+0.4
2.25%
jan 1, 1983
17.938
-0.287
-1.57%
jan 1, 1984
16.475
-1.464
-8.16%
jan 1, 1985
15.852
-0.623
-3.78%
jan 1, 1986
17.193
+1.341
8.46%
jan 1, 1987
17.744
+0.551
3.21%
jan 1, 1988
18.434
+0.69
3.89%
jan 1, 1989
17.55
-0.885
-4.8%
jan 1, 1990
17.341
-0.208
-1.19%
jan 1, 1991
15.698
-1.644
-9.48%
jan 1, 1992
15.574
-0.124
-0.79%
jan 1, 1993
16.465
+0.891
5.72%
jan 1, 1994
17.94
+1.475
8.96%
jan 1, 1995
17.353
-0.587
-3.27%
jan 1, 1996
18.035
+0.682
3.93%
jan 1, 1997
15.797
-2.238
-12.41%
jan 1, 1998
17.019
+1.221
7.73%
jan 1, 1999
15.91
-1.109
-6.51%
jan 1, 2000
17.116
+1.206
7.58%
jan 1, 2001
17.604
+0.488
2.85%
jan 1, 2002
17.887
+0.283
1.61%
jan 1, 2003
17.64
-0.247
-1.38%
jan 1, 2004
17.423
-0.217
-1.23%
jan 1, 2005
17.905
+0.482
2.76%
jan 1, 2006
18.547
+0.642
3.59%
jan 1, 2007
17.842
-0.705
-3.8%
jan 1, 2008
17.515
-0.327
-1.83%
jan 1, 2009
16.767
-0.747
-4.27%
jan 1, 2010
18.24
+1.473
8.78%
jan 1, 2011
17.948
-0.292
-1.6%
jan 1, 2012
18.701
+0.753
4.19%
jan 1, 2013
19.837
+1.136
6.07%
jan 1, 2014
19.858
+0.021
0.11%
jan 1, 2015
19.903
+0.045
0.23%
jan 1, 2016
19.214
-0.689
-3.46%
Ranking of countries by current statistics by years


Comments: