29
/
en
AIzaSyAYiBZKx7MnpbEhh9jyipgxe19OcubqV5w
April 1, 2024
38996
IDA only
IDX
false
2
1
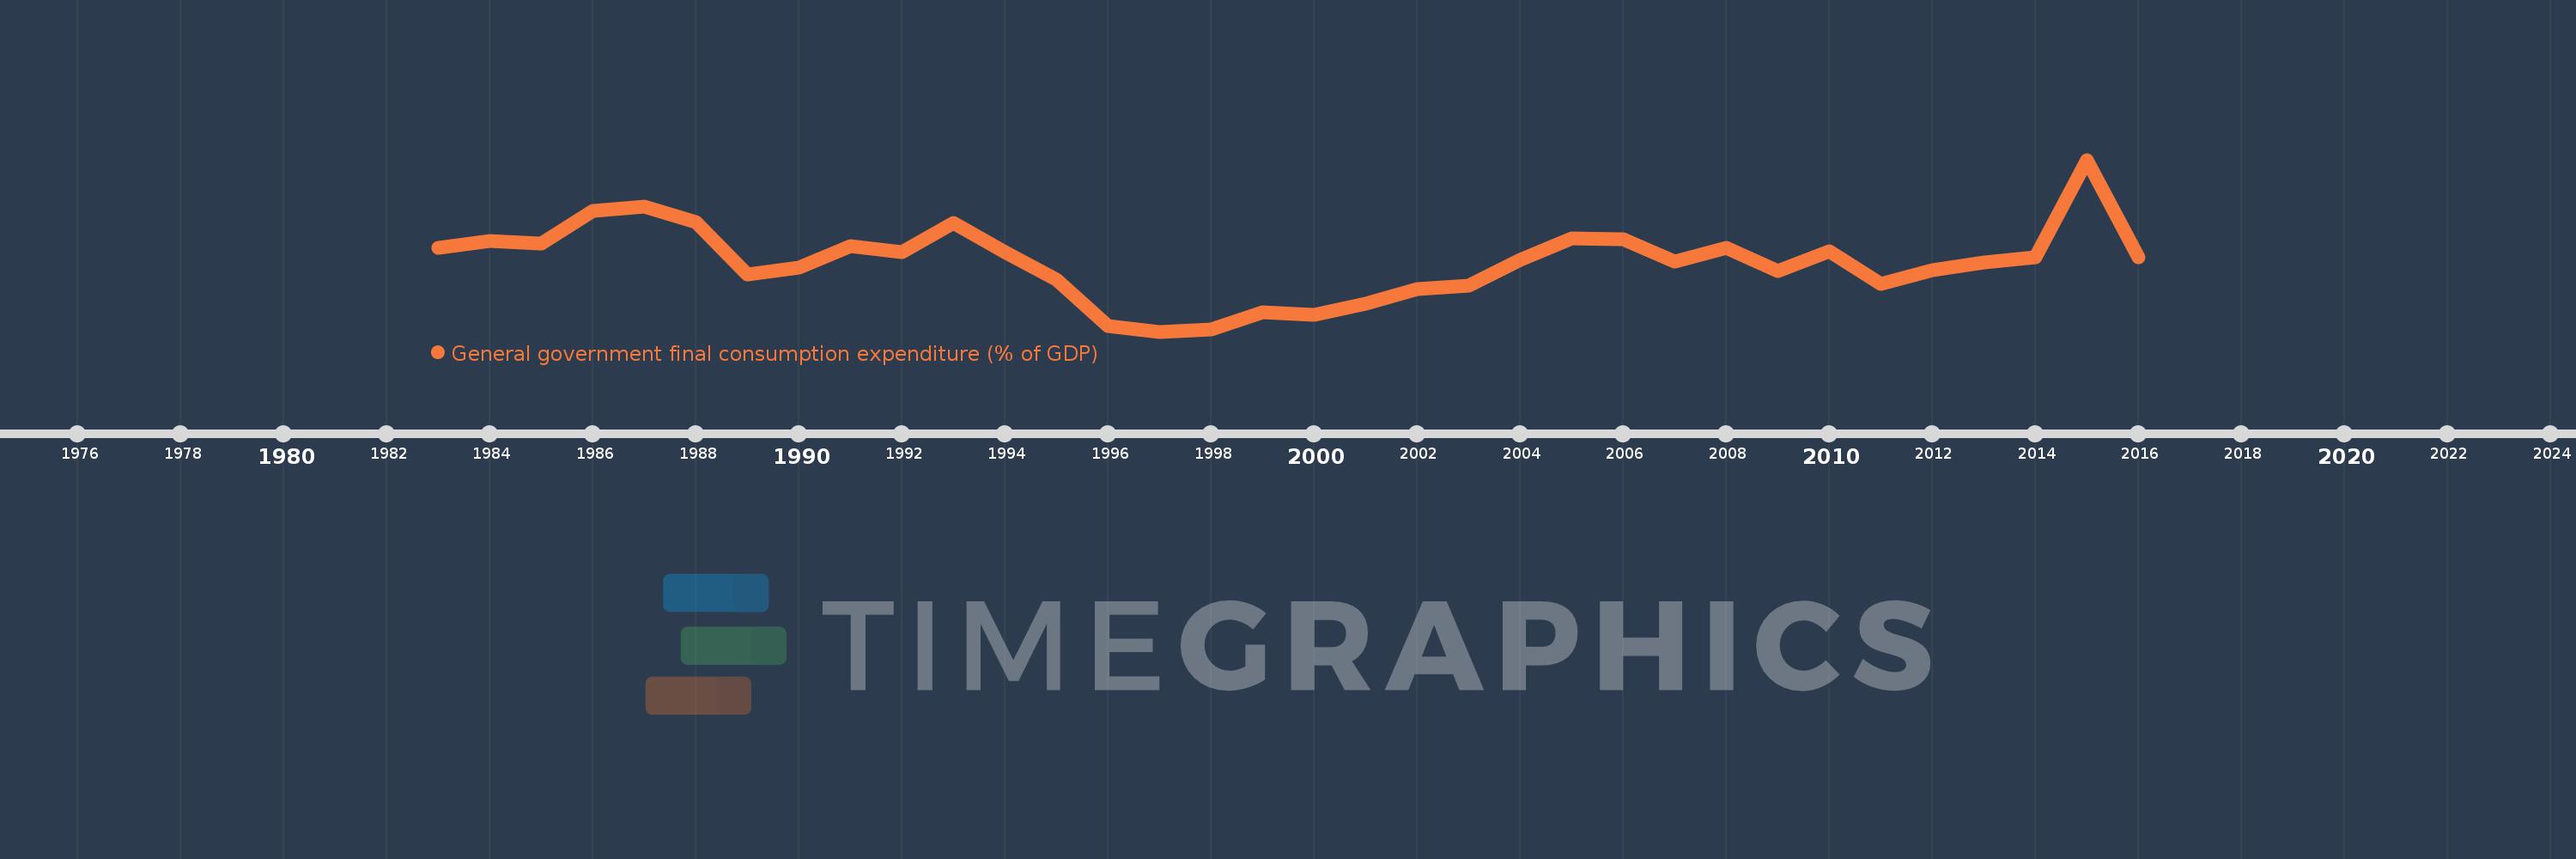
General government final consumption expenditure (% of GDP)
2016,2015,2014,2013,2012,2011,2010,2009,2008,2007,2006,2005,2004,2003,2002,2001,2000,1999,1998,1997,1996,1995,1994,1993,1992,1991,1990,1989,1988,1987,1986,1985,1984,1983
This statistics in other country:
AfghanistanAlbaniaAlgeriaAngolaAntigua and BarbudaArab WorldArgentinaArmeniaArubaAustraliaAustriaAzerbaijanBahamas, TheBahrainBangladeshBarbadosBelarusBelgiumBelizeBeninBermudaBhutanBoliviaBosnia and HerzegovinaBotswanaBrazilBrunei DarussalamBulgariaBurkina FasoBurundiCabo VerdeCambodiaCameroonCanadaCaribbean small statesCentral African RepublicCentral Europe and the BalticsChadChileChinaColombiaComorosCongo, Dem. Rep.Congo, Rep.Costa RicaCote d'IvoireCroatiaCubaCyprusCzech RepublicDenmarkDjiboutiDominicaDominican RepublicEarly-demographic dividendEast Asia & PacificEast Asia & Pacific (excluding high income)East Asia & Pacific (IDA & IBRD countries)EcuadorEgypt, Arab Rep.El SalvadorEquatorial GuineaEritreaEstoniaEthiopiaEuro areaEurope & Central AsiaEurope & Central Asia (excluding high income)Europe & Central Asia (IDA & IBRD countries)European UnionFaroe IslandsFijiFinlandFragile and conflict affected situationsFranceFrench PolynesiaGabonGambia, TheGeorgiaGermanyGhanaGreeceGrenadaGuatemalaGuineaGuinea-BissauGuyanaHaitiHeavily indebted poor countries (HIPC)High incomeHondurasHong Kong SAR, ChinaHungaryIBRD onlyIcelandIDA & IBRD totalIDA blendIDA onlyIDA totalIndiaIndonesiaIran, Islamic Rep.IraqIrelandIsraelItalyJamaicaJapanJordanKazakhstanKenyaKiribatiKorea, Rep.KosovoKuwaitKyrgyz RepublicLao PDRLate-demographic dividendLatin America & Caribbean Latin America & Caribbean (excluding high income)Latin America & the Caribbean (IDA & IBRD countries)LatviaLeast developed countries: UN classificationLebanonLesothoLiberiaLibyaLithuaniaLow & middle incomeLow incomeLower middle incomeLuxembourgMacao SAR, ChinaMacedonia, FYRMadagascarMalawiMalaysiaMaldivesMaliMaltaMauritaniaMauritiusMexicoMicronesia, Fed. Sts.Middle East & North AfricaMiddle East & North Africa (excluding high income)Middle East & North Africa (IDA & IBRD countries)Middle incomeMoldovaMongoliaMontenegroMoroccoMozambiqueNamibiaNepalNetherlandsNew CaledoniaNew ZealandNicaraguaNigerNigeriaNorth AmericaNorwayOECD membersOmanOther small statesPacific island small statesPakistanPanamaPapua New GuineaParaguayPeruPhilippinesPolandPortugalPost-demographic dividendPre-demographic dividendPuerto RicoQatarRomaniaRussian FederationRwandaSaudi ArabiaSenegalSerbiaSeychellesSierra LeoneSingaporeSlovak RepublicSloveniaSmall statesSolomon IslandsSomaliaSouth AfricaSouth AsiaSouth Asia (IDA & IBRD)South SudanSpainSri LankaSt. Kitts and NevisSt. LuciaSt. Vincent and the GrenadinesSub-Saharan Africa Sub-Saharan Africa (excluding high income)Sub-Saharan Africa (IDA & IBRD countries)SudanSurinameSwazilandSwedenSwitzerlandSyrian Arab RepublicTajikistanTanzaniaThailandTimor-LesteTogoTongaTrinidad and TobagoTunisiaTurkeyTurkmenistanUgandaUkraineUnited Arab EmiratesUnited KingdomUnited StatesUpper middle incomeUruguayUzbekistanVanuatuVenezuela, RBVietnamWest Bank and GazaWorldYemen, Rep.ZambiaZimbabwe Timeline:
This timeline shows a graph from 1983 to 2016 of IDA only. No data until 1982. Number of actual observations by date: 34.
Source name:
World Development Indicators
Source organization:
World Bank national accounts data, and OECD National Accounts data files.
Categories, topics:
Economy & Growth
Last updated:
apr 23, 2017
Indicators value changes by year
Minimum:
10.042
jan 1, 1997
Maximum:
13.904
jan 1, 2015
At the date of observation
Value
Absolute change
Change from previous value
jan 1, 1983
11.931
+11.931
0.0%
jan 1, 1984
12.084
+0.153
1.29%
jan 1, 1985
12.027
-0.057
-0.47%
jan 1, 1986
12.753
+0.725
6.03%
jan 1, 1987
12.852
+0.099
0.78%
jan 1, 1988
12.503
-0.349
-2.71%
jan 1, 1989
11.328
-1.175
-9.4%
jan 1, 1990
11.48
+0.152
1.34%
jan 1, 1991
11.965
+0.485
4.22%
jan 1, 1992
11.831
-0.134
-1.12%
jan 1, 1993
12.486
+0.655
5.53%
jan 1, 1994
11.832
-0.654
-5.24%
jan 1, 1995
11.206
-0.625
-5.29%
jan 1, 1996
10.167
-1.039
-9.28%
jan 1, 1997
10.042
-0.125
-1.23%
jan 1, 1998
10.092
+0.049
0.49%
jan 1, 1999
10.481
+0.389
3.86%
jan 1, 2000
10.414
-0.067
-0.64%
jan 1, 2001
10.679
+0.264
2.54%
jan 1, 2002
10.993
+0.315
2.95%
jan 1, 2003
11.077
+0.084
0.76%
jan 1, 2004
11.655
+0.578
5.22%
jan 1, 2005
12.132
+0.477
4.09%
jan 1, 2006
12.122
-0.01
-0.08%
jan 1, 2007
11.615
-0.507
-4.19%
jan 1, 2008
11.931
+0.316
2.72%
jan 1, 2009
11.406
-0.525
-4.4%
jan 1, 2010
11.839
+0.432
3.79%
jan 1, 2011
11.112
-0.726
-6.13%
jan 1, 2012
11.418
+0.306
2.75%
jan 1, 2013
11.588
+0.17
1.49%
jan 1, 2014
11.714
+0.125
1.08%
jan 1, 2015
13.904
+2.19
18.7%
jan 1, 2016
11.707
-2.196
-15.8%
Ranking of countries by current statistics by years


Comments: