29
/
en
AIzaSyAYiBZKx7MnpbEhh9jyipgxe19OcubqV5w
April 1, 2024
136734
Gambia, The
GMB
true
2
1
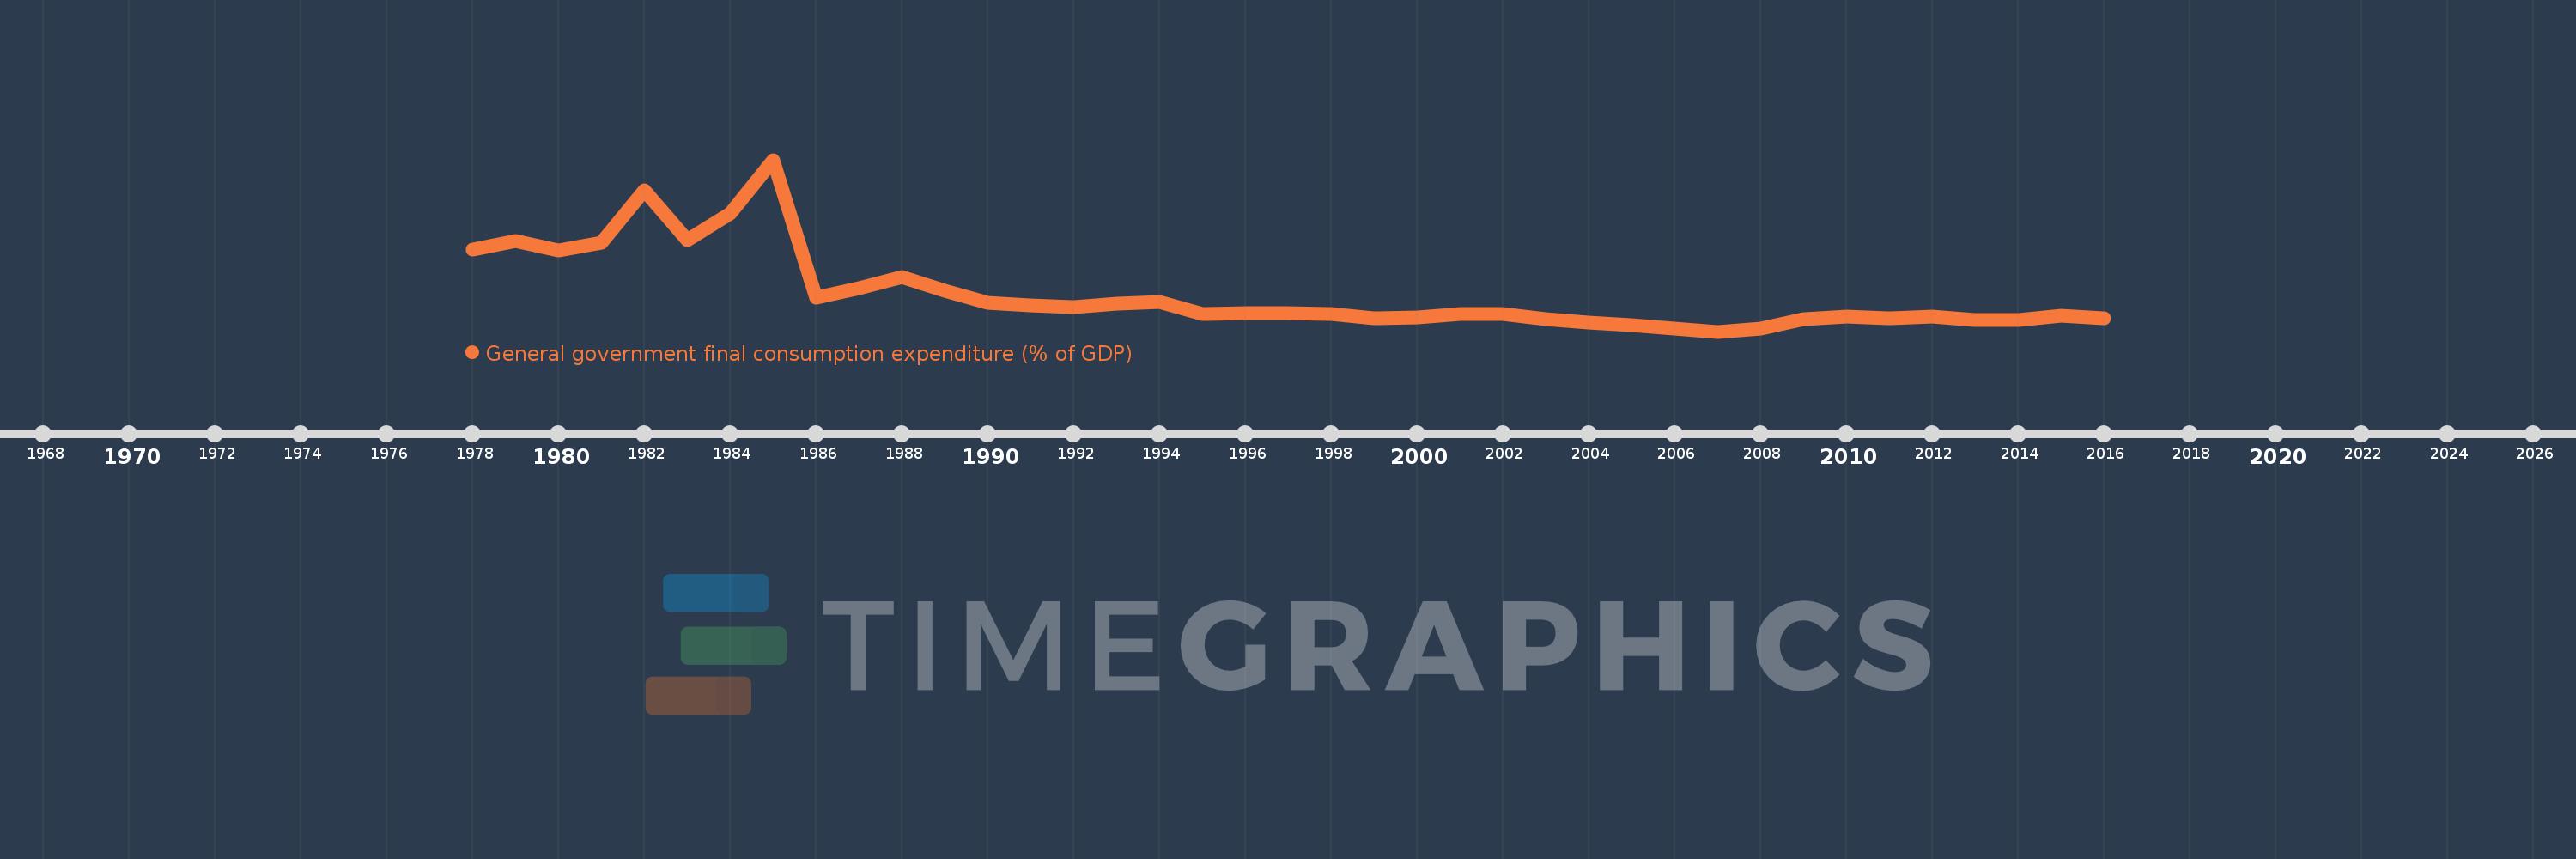
General government final consumption expenditure (% of GDP)
2016,2015,2014,2013,2012,2011,2010,2009,2008,2007,2006,2005,2004,2003,2002,2001,2000,1999,1998,1997,1996,1995,1994,1993,1992,1991,1990,1989,1988,1987,1986,1985,1984,1983,1982,1981,1980,1979,1978
This statistics in other country:
AfghanistanAlbaniaAlgeriaAngolaAntigua and BarbudaArab WorldArgentinaArmeniaArubaAustraliaAustriaAzerbaijanBahamas, TheBahrainBangladeshBarbadosBelarusBelgiumBelizeBeninBermudaBhutanBoliviaBosnia and HerzegovinaBotswanaBrazilBrunei DarussalamBulgariaBurkina FasoBurundiCabo VerdeCambodiaCameroonCanadaCaribbean small statesCentral African RepublicCentral Europe and the BalticsChadChileChinaColombiaComorosCongo, Dem. Rep.Congo, Rep.Costa RicaCote d'IvoireCroatiaCubaCyprusCzech RepublicDenmarkDjiboutiDominicaDominican RepublicEarly-demographic dividendEast Asia & PacificEast Asia & Pacific (excluding high income)East Asia & Pacific (IDA & IBRD countries)EcuadorEgypt, Arab Rep.El SalvadorEquatorial GuineaEritreaEstoniaEthiopiaEuro areaEurope & Central AsiaEurope & Central Asia (excluding high income)Europe & Central Asia (IDA & IBRD countries)European UnionFaroe IslandsFijiFinlandFragile and conflict affected situationsFranceFrench PolynesiaGabonGambia, TheGeorgiaGermanyGhanaGreeceGrenadaGuatemalaGuineaGuinea-BissauGuyanaHaitiHeavily indebted poor countries (HIPC)High incomeHondurasHong Kong SAR, ChinaHungaryIBRD onlyIcelandIDA & IBRD totalIDA blendIDA onlyIDA totalIndiaIndonesiaIran, Islamic Rep.IraqIrelandIsraelItalyJamaicaJapanJordanKazakhstanKenyaKiribatiKorea, Rep.KosovoKuwaitKyrgyz RepublicLao PDRLate-demographic dividendLatin America & Caribbean Latin America & Caribbean (excluding high income)Latin America & the Caribbean (IDA & IBRD countries)LatviaLeast developed countries: UN classificationLebanonLesothoLiberiaLibyaLithuaniaLow & middle incomeLow incomeLower middle incomeLuxembourgMacao SAR, ChinaMacedonia, FYRMadagascarMalawiMalaysiaMaldivesMaliMaltaMauritaniaMauritiusMexicoMicronesia, Fed. Sts.Middle East & North AfricaMiddle East & North Africa (excluding high income)Middle East & North Africa (IDA & IBRD countries)Middle incomeMoldovaMongoliaMontenegroMoroccoMozambiqueNamibiaNepalNetherlandsNew CaledoniaNew ZealandNicaraguaNigerNigeriaNorth AmericaNorwayOECD membersOmanOther small statesPacific island small statesPakistanPanamaPapua New GuineaParaguayPeruPhilippinesPolandPortugalPost-demographic dividendPre-demographic dividendPuerto RicoQatarRomaniaRussian FederationRwandaSaudi ArabiaSenegalSerbiaSeychellesSierra LeoneSingaporeSlovak RepublicSloveniaSmall statesSolomon IslandsSomaliaSouth AfricaSouth AsiaSouth Asia (IDA & IBRD)South SudanSpainSri LankaSt. Kitts and NevisSt. LuciaSt. Vincent and the GrenadinesSub-Saharan Africa Sub-Saharan Africa (excluding high income)Sub-Saharan Africa (IDA & IBRD countries)SudanSurinameSwazilandSwedenSwitzerlandSyrian Arab RepublicTajikistanTanzaniaThailandTimor-LesteTogoTongaTrinidad and TobagoTunisiaTurkeyTurkmenistanUgandaUkraineUnited Arab EmiratesUnited KingdomUnited StatesUpper middle incomeUruguayUzbekistanVanuatuVenezuela, RBVietnamWest Bank and GazaWorldYemen, Rep.ZambiaZimbabwe Timeline:
This timeline shows a graph from 1978 to 2016 of Gambia, The. No data until 1977. Number of actual observations by date: 39.
Source name:
World Development Indicators
Source organization:
World Bank national accounts data, and OECD National Accounts data files.
Categories, topics:
Economy & Growth
Last updated:
apr 23, 2017
Indicators value changes by year
Maximum:
54.515
jan 1, 1985
At the date of observation
Value
Absolute change
Change from previous value
jan 1, 1978
29.244
+29.244
0.0%
jan 1, 1979
31.669
+2.425
8.29%
jan 1, 1980
29.096
-2.572
-8.12%
jan 1, 1981
31.212
+2.116
7.27%
jan 1, 1982
45.959
+14.747
47.25%
jan 1, 1983
31.901
-14.058
-30.59%
jan 1, 1984
39.364
+7.463
23.39%
jan 1, 1985
54.515
+15.151
38.49%
jan 1, 1986
15.934
-38.582
-70.77%
jan 1, 1987
18.447
+2.513
15.77%
jan 1, 1988
21.707
+3.26
17.67%
jan 1, 1989
17.821
-3.886
-17.9%
jan 1, 1990
14.42
-3.401
-19.08%
jan 1, 1991
13.747
-0.673
-4.66%
jan 1, 1992
13.082
-0.666
-4.84%
jan 1, 1993
14.163
+1.082
8.27%
jan 1, 1994
14.539
+0.375
2.65%
jan 1, 1995
11.352
-3.186
-21.92%
jan 1, 1996
11.566
+0.214
1.88%
jan 1, 1997
11.436
-0.13
-1.12%
jan 1, 1998
11.265
-0.171
-1.49%
jan 1, 1999
9.99
-1.275
-11.32%
jan 1, 2000
10.338
+0.348
3.48%
jan 1, 2001
11.227
+0.889
8.6%
jan 1, 2002
11.367
+0.14
1.24%
jan 1, 2003
9.923
-1.444
-12.7%
jan 1, 2004
8.755
-1.168
-11.77%
jan 1, 2005
8.078
-0.677
-7.73%
jan 1, 2006
7.073
-1.006
-12.45%
jan 1, 2007
6.331
-0.741
-10.48%
jan 1, 2008
7.245
+0.913
14.42%
jan 1, 2009
9.731
+2.486
34.32%
jan 1, 2010
10.462
+0.731
7.51%
jan 1, 2011
10.031
-0.431
-4.12%
jan 1, 2012
10.647
+0.616
6.14%
jan 1, 2013
9.571
-1.076
-10.11%
jan 1, 2014
9.57
-0.001
-0.01%
jan 1, 2015
10.732
+1.162
12.15%
jan 1, 2016
10.082
-0.65
-6.06%
Ranking of countries by current statistics by years


Comments: