29
/
en
AIzaSyAYiBZKx7MnpbEhh9jyipgxe19OcubqV5w
April 1, 2024
171712
Kuwait
KWT
true
2
1
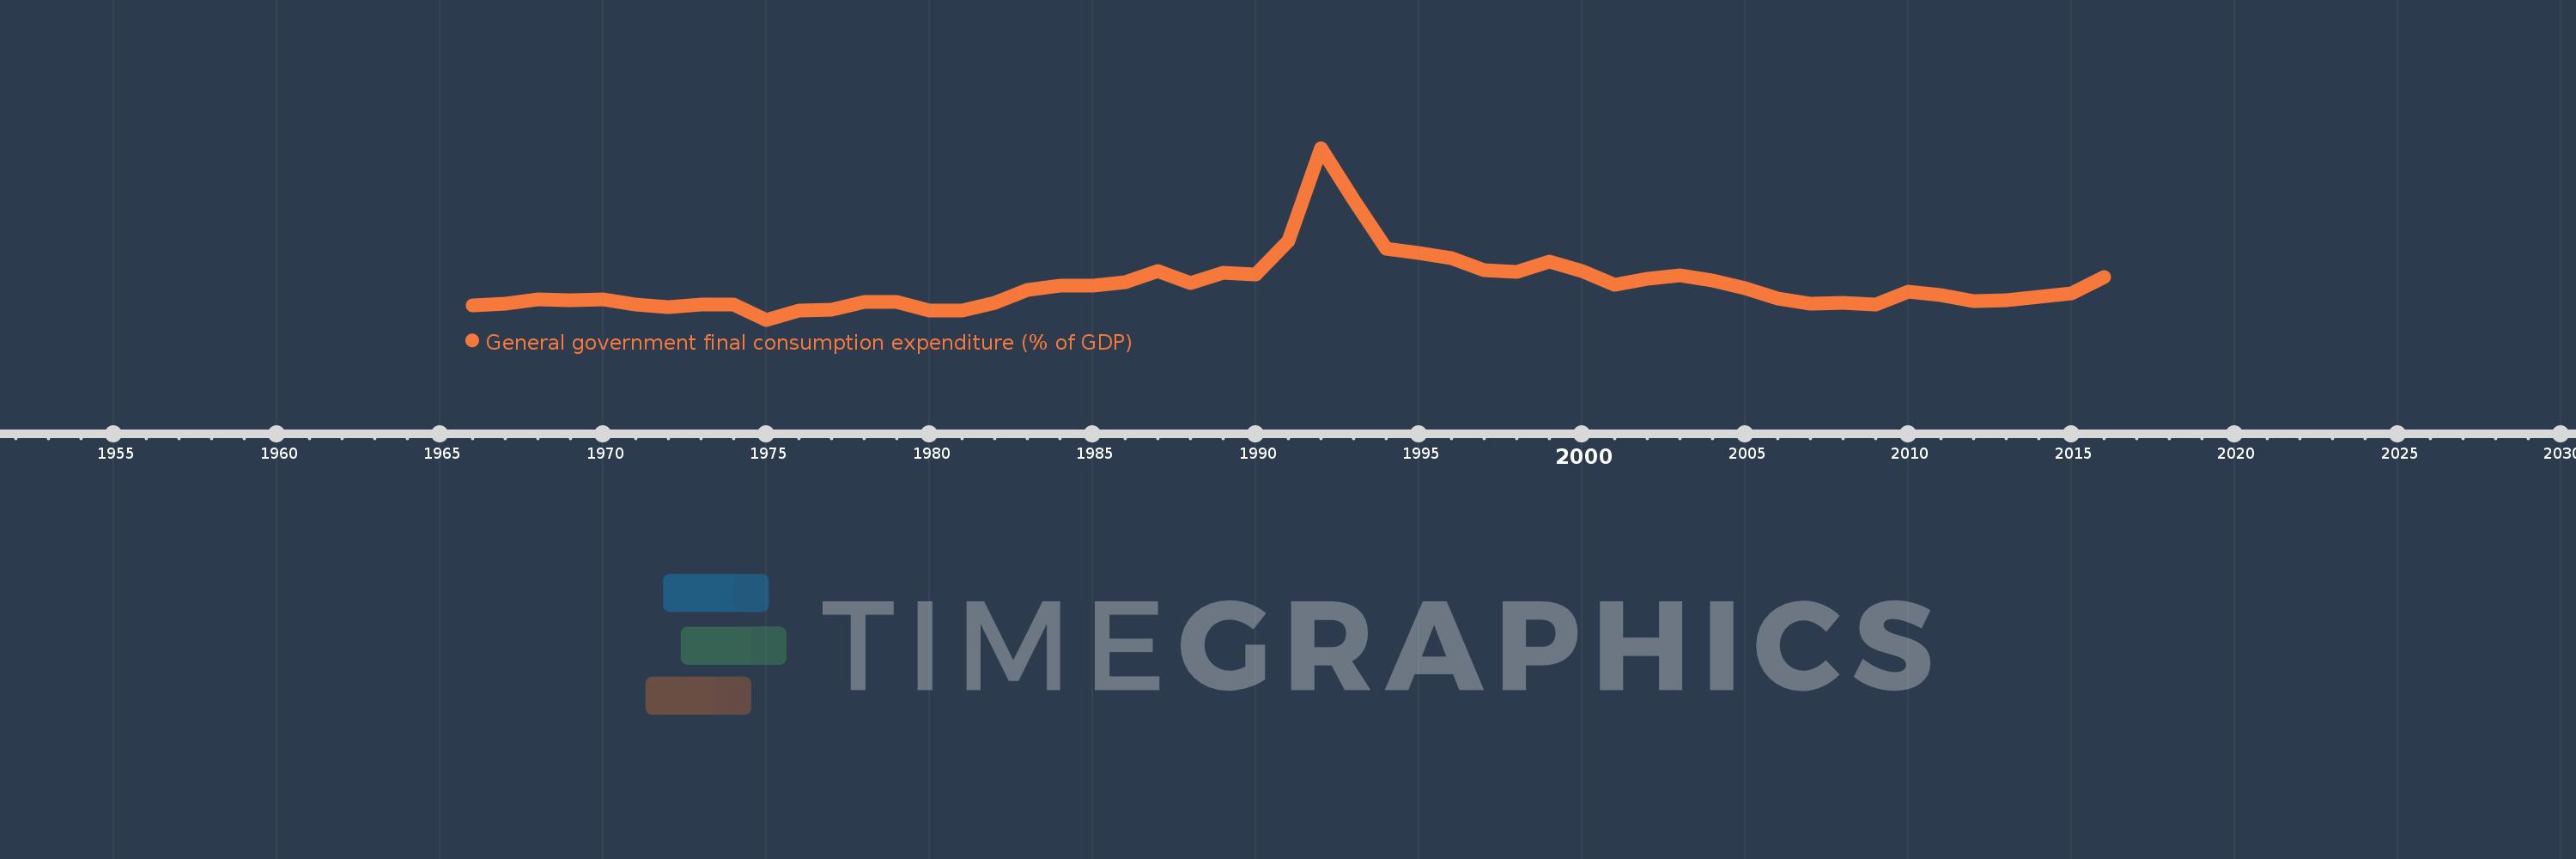
General government final consumption expenditure (% of GDP)
2016,2015,2014,2013,2012,2011,2010,2009,2008,2007,2006,2005,2004,2003,2002,2001,2000,1999,1998,1997,1996,1995,1994,1993,1992,1991,1990,1989,1988,1987,1986,1985,1984,1983,1982,1981,1980,1979,1978,1977,1976,1975,1974,1973,1972,1971,1970,1969,1968,1967,1966
This statistics in other country:
AfghanistanAlbaniaAlgeriaAngolaAntigua and BarbudaArab WorldArgentinaArmeniaArubaAustraliaAustriaAzerbaijanBahamas, TheBahrainBangladeshBarbadosBelarusBelgiumBelizeBeninBermudaBhutanBoliviaBosnia and HerzegovinaBotswanaBrazilBrunei DarussalamBulgariaBurkina FasoBurundiCabo VerdeCambodiaCameroonCanadaCaribbean small statesCentral African RepublicCentral Europe and the BalticsChadChileChinaColombiaComorosCongo, Dem. Rep.Congo, Rep.Costa RicaCote d'IvoireCroatiaCubaCyprusCzech RepublicDenmarkDjiboutiDominicaDominican RepublicEarly-demographic dividendEast Asia & PacificEast Asia & Pacific (excluding high income)East Asia & Pacific (IDA & IBRD countries)EcuadorEgypt, Arab Rep.El SalvadorEquatorial GuineaEritreaEstoniaEthiopiaEuro areaEurope & Central AsiaEurope & Central Asia (excluding high income)Europe & Central Asia (IDA & IBRD countries)European UnionFaroe IslandsFijiFinlandFragile and conflict affected situationsFranceFrench PolynesiaGabonGambia, TheGeorgiaGermanyGhanaGreeceGrenadaGuatemalaGuineaGuinea-BissauGuyanaHaitiHeavily indebted poor countries (HIPC)High incomeHondurasHong Kong SAR, ChinaHungaryIBRD onlyIcelandIDA & IBRD totalIDA blendIDA onlyIDA totalIndiaIndonesiaIran, Islamic Rep.IraqIrelandIsraelItalyJamaicaJapanJordanKazakhstanKenyaKiribatiKorea, Rep.KosovoKuwaitKyrgyz RepublicLao PDRLate-demographic dividendLatin America & Caribbean Latin America & Caribbean (excluding high income)Latin America & the Caribbean (IDA & IBRD countries)LatviaLeast developed countries: UN classificationLebanonLesothoLiberiaLibyaLithuaniaLow & middle incomeLow incomeLower middle incomeLuxembourgMacao SAR, ChinaMacedonia, FYRMadagascarMalawiMalaysiaMaldivesMaliMaltaMauritaniaMauritiusMexicoMicronesia, Fed. Sts.Middle East & North AfricaMiddle East & North Africa (excluding high income)Middle East & North Africa (IDA & IBRD countries)Middle incomeMoldovaMongoliaMontenegroMoroccoMozambiqueNamibiaNepalNetherlandsNew CaledoniaNew ZealandNicaraguaNigerNigeriaNorth AmericaNorwayOECD membersOmanOther small statesPacific island small statesPakistanPanamaPapua New GuineaParaguayPeruPhilippinesPolandPortugalPost-demographic dividendPre-demographic dividendPuerto RicoQatarRomaniaRussian FederationRwandaSaudi ArabiaSenegalSerbiaSeychellesSierra LeoneSingaporeSlovak RepublicSloveniaSmall statesSolomon IslandsSomaliaSouth AfricaSouth AsiaSouth Asia (IDA & IBRD)South SudanSpainSri LankaSt. Kitts and NevisSt. LuciaSt. Vincent and the GrenadinesSub-Saharan Africa Sub-Saharan Africa (excluding high income)Sub-Saharan Africa (IDA & IBRD countries)SudanSurinameSwazilandSwedenSwitzerlandSyrian Arab RepublicTajikistanTanzaniaThailandTimor-LesteTogoTongaTrinidad and TobagoTunisiaTurkeyTurkmenistanUgandaUkraineUnited Arab EmiratesUnited KingdomUnited StatesUpper middle incomeUruguayUzbekistanVanuatuVenezuela, RBVietnamWest Bank and GazaWorldYemen, Rep.ZambiaZimbabwe Timeline:
This timeline shows a graph from 1966 to 2016 of Kuwait. No data until 1965. Number of actual observations by date: 51.
Source name:
World Development Indicators
Source organization:
World Bank national accounts data, and OECD National Accounts data files.
Categories, topics:
Economy & Growth
Last updated:
apr 23, 2017
Indicators value changes by year
Maximum:
76.222
jan 1, 1992
At the date of observation
Value
Absolute change
Change from previous value
jan 1, 1966
13.218
+13.218
0.0%
jan 1, 1967
13.817
+0.6
4.54%
jan 1, 1968
15.482
+1.664
12.05%
jan 1, 1969
15.142
-0.34
-2.19%
jan 1, 1970
15.369
+0.227
1.5%
jan 1, 1971
13.573
-1.796
-11.69%
jan 1, 1972
12.542
-1.031
-7.6%
jan 1, 1973
13.566
+1.024
8.16%
jan 1, 1974
13.378
-0.187
-1.38%
jan 1, 1975
7.32
-6.059
-45.29%
jan 1, 1976
11.055
+3.736
51.04%
jan 1, 1977
11.259
+0.203
1.84%
jan 1, 1978
14.472
+3.213
28.54%
jan 1, 1979
14.443
-0.029
-0.2%
jan 1, 1980
11.167
-3.276
-22.68%
jan 1, 1981
11.173
+0.006
0.05%
jan 1, 1982
14.217
+3.044
27.25%
jan 1, 1983
19.271
+5.054
35.55%
jan 1, 1984
21.159
+1.888
9.8%
jan 1, 1985
20.938
-0.221
-1.05%
jan 1, 1986
22.402
+1.464
6.99%
jan 1, 1987
26.97
+4.568
20.39%
jan 1, 1988
22.038
-4.932
-18.29%
jan 1, 1989
26.272
+4.235
19.22%
jan 1, 1990
25.397
-0.875
-3.33%
jan 1, 1991
38.749
+13.352
52.57%
jan 1, 1992
76.222
+37.473
96.71%
jan 1, 1993
55.55
-20.672
-27.12%
jan 1, 1994
35.864
-19.685
-35.44%
jan 1, 1995
33.923
-1.942
-5.41%
jan 1, 1996
32.191
-1.731
-5.1%
jan 1, 1997
27.266
-4.925
-15.3%
jan 1, 1998
26.622
-0.644
-2.36%
jan 1, 1999
30.504
+3.882
14.58%
jan 1, 2000
26.862
-3.642
-11.94%
jan 1, 2001
21.478
-5.384
-20.04%
jan 1, 2002
23.633
+2.155
10.04%
jan 1, 2003
25.272
+1.638
6.93%
jan 1, 2004
22.997
-2.275
-9.0%
jan 1, 2005
19.855
-3.142
-13.66%
jan 1, 2006
15.712
-4.143
-20.86%
jan 1, 2007
13.895
-1.817
-11.56%
jan 1, 2008
14.005
+0.11
0.79%
jan 1, 2009
13.397
-0.608
-4.34%
jan 1, 2010
18.49
+5.093
38.01%
jan 1, 2011
17.13
-1.36
-7.35%
jan 1, 2012
14.882
-2.248
-13.13%
jan 1, 2013
15.06
+0.178
1.19%
jan 1, 2014
16.387
+1.327
8.81%
jan 1, 2015
17.755
+1.368
8.35%
jan 1, 2016
24.558
+6.803
38.31%
Ranking of countries by current statistics by years


Comments: