29
/
en
AIzaSyAYiBZKx7MnpbEhh9jyipgxe19OcubqV5w
April 1, 2024
157293
Iran, Islamic Rep.
IRN
true
2
1
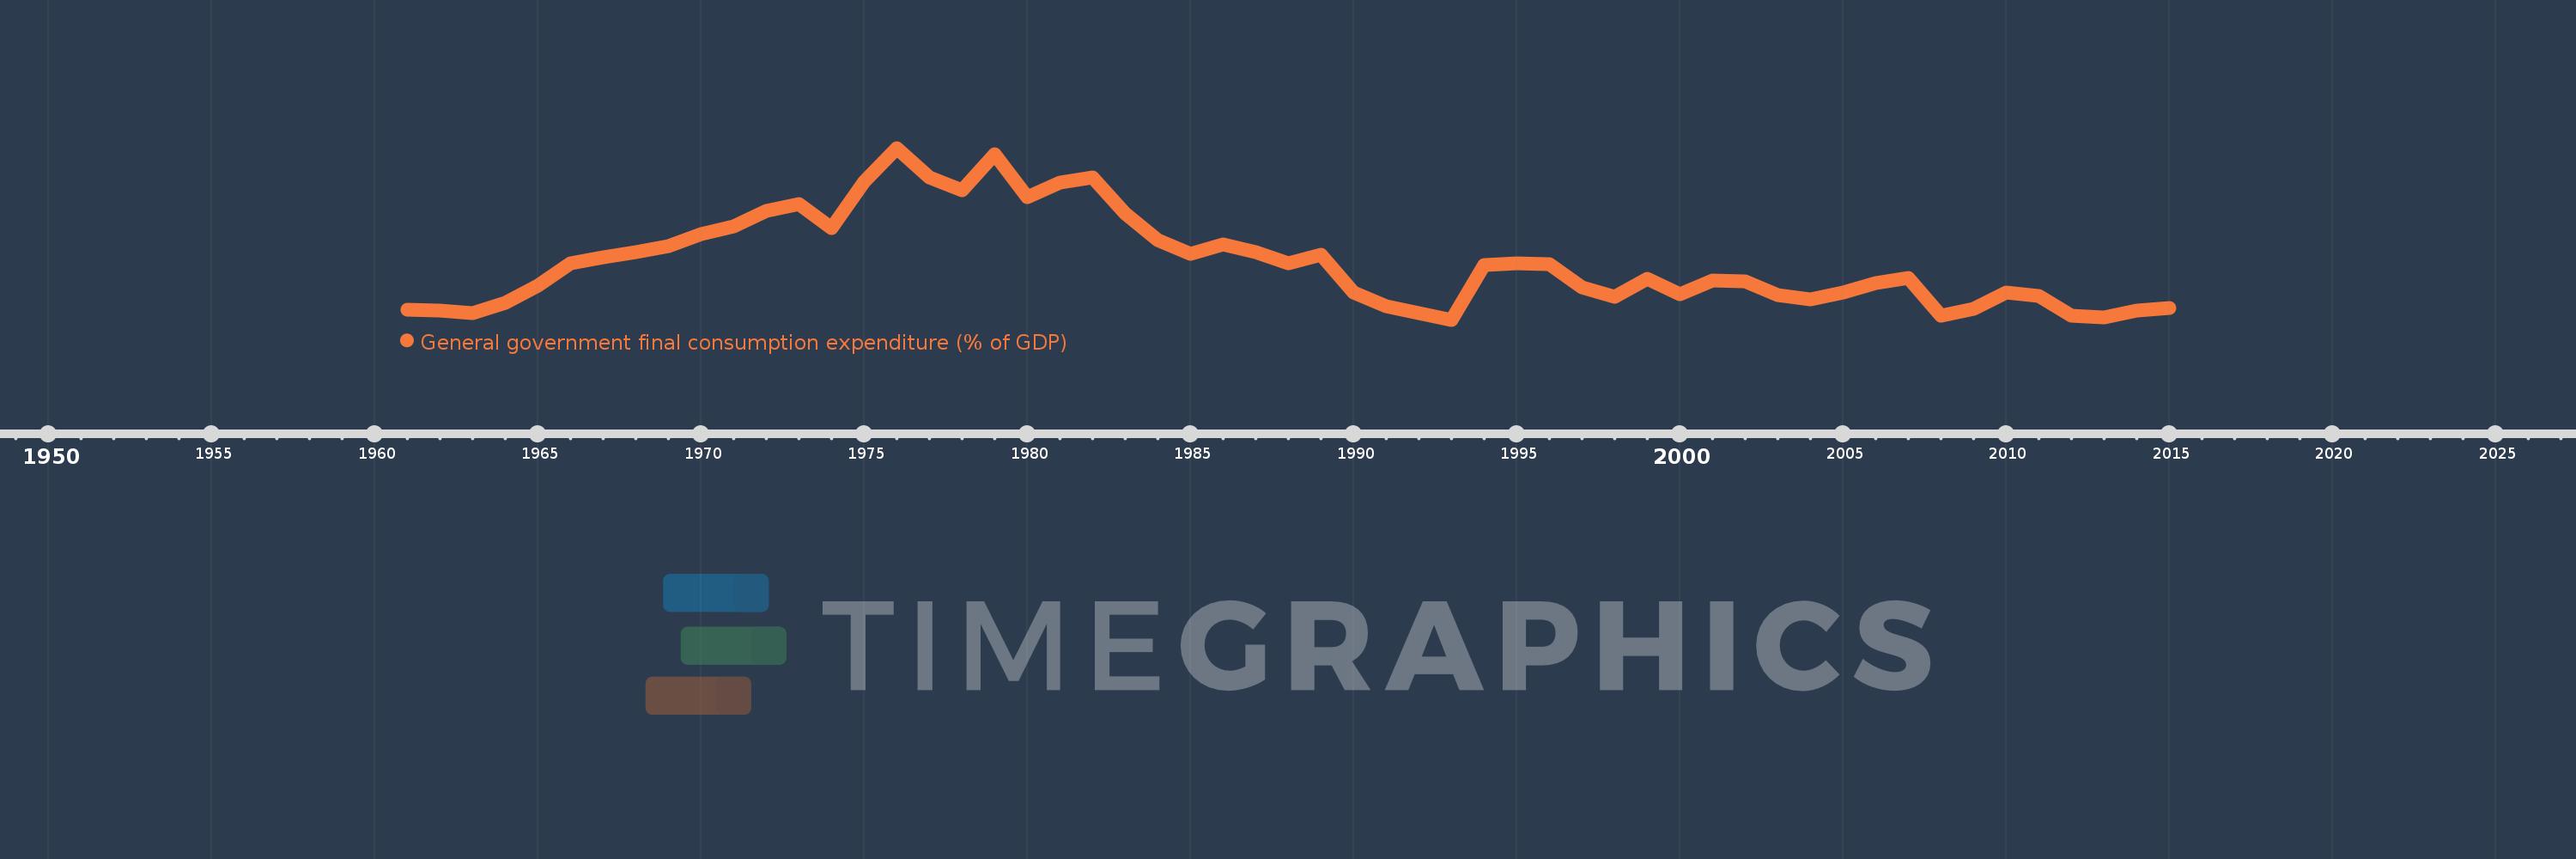
General government final consumption expenditure (% of GDP)
2015,2014,2013,2012,2011,2010,2009,2008,2007,2006,2005,2004,2003,2002,2001,2000,1999,1998,1997,1996,1995,1994,1993,1992,1991,1990,1989,1988,1987,1986,1985,1984,1983,1982,1981,1980,1979,1978,1977,1976,1975,1974,1973,1972,1971,1970,1969,1968,1967,1966,1965,1964,1963,1962,1961
This statistics in other country:
AfghanistanAlbaniaAlgeriaAngolaAntigua and BarbudaArab WorldArgentinaArmeniaArubaAustraliaAustriaAzerbaijanBahamas, TheBahrainBangladeshBarbadosBelarusBelgiumBelizeBeninBermudaBhutanBoliviaBosnia and HerzegovinaBotswanaBrazilBrunei DarussalamBulgariaBurkina FasoBurundiCabo VerdeCambodiaCameroonCanadaCaribbean small statesCentral African RepublicCentral Europe and the BalticsChadChileChinaColombiaComorosCongo, Dem. Rep.Congo, Rep.Costa RicaCote d'IvoireCroatiaCubaCyprusCzech RepublicDenmarkDjiboutiDominicaDominican RepublicEarly-demographic dividendEast Asia & PacificEast Asia & Pacific (excluding high income)East Asia & Pacific (IDA & IBRD countries)EcuadorEgypt, Arab Rep.El SalvadorEquatorial GuineaEritreaEstoniaEthiopiaEuro areaEurope & Central AsiaEurope & Central Asia (excluding high income)Europe & Central Asia (IDA & IBRD countries)European UnionFaroe IslandsFijiFinlandFragile and conflict affected situationsFranceFrench PolynesiaGabonGambia, TheGeorgiaGermanyGhanaGreeceGrenadaGuatemalaGuineaGuinea-BissauGuyanaHaitiHeavily indebted poor countries (HIPC)High incomeHondurasHong Kong SAR, ChinaHungaryIBRD onlyIcelandIDA & IBRD totalIDA blendIDA onlyIDA totalIndiaIndonesiaIran, Islamic Rep.IraqIrelandIsraelItalyJamaicaJapanJordanKazakhstanKenyaKiribatiKorea, Rep.KosovoKuwaitKyrgyz RepublicLao PDRLate-demographic dividendLatin America & Caribbean Latin America & Caribbean (excluding high income)Latin America & the Caribbean (IDA & IBRD countries)LatviaLeast developed countries: UN classificationLebanonLesothoLiberiaLibyaLithuaniaLow & middle incomeLow incomeLower middle incomeLuxembourgMacao SAR, ChinaMacedonia, FYRMadagascarMalawiMalaysiaMaldivesMaliMaltaMauritaniaMauritiusMexicoMicronesia, Fed. Sts.Middle East & North AfricaMiddle East & North Africa (excluding high income)Middle East & North Africa (IDA & IBRD countries)Middle incomeMoldovaMongoliaMontenegroMoroccoMozambiqueNamibiaNepalNetherlandsNew CaledoniaNew ZealandNicaraguaNigerNigeriaNorth AmericaNorwayOECD membersOmanOther small statesPacific island small statesPakistanPanamaPapua New GuineaParaguayPeruPhilippinesPolandPortugalPost-demographic dividendPre-demographic dividendPuerto RicoQatarRomaniaRussian FederationRwandaSaudi ArabiaSenegalSerbiaSeychellesSierra LeoneSingaporeSlovak RepublicSloveniaSmall statesSolomon IslandsSomaliaSouth AfricaSouth AsiaSouth Asia (IDA & IBRD)South SudanSpainSri LankaSt. Kitts and NevisSt. LuciaSt. Vincent and the GrenadinesSub-Saharan Africa Sub-Saharan Africa (excluding high income)Sub-Saharan Africa (IDA & IBRD countries)SudanSurinameSwazilandSwedenSwitzerlandSyrian Arab RepublicTajikistanTanzaniaThailandTimor-LesteTogoTongaTrinidad and TobagoTunisiaTurkeyTurkmenistanUgandaUkraineUnited Arab EmiratesUnited KingdomUnited StatesUpper middle incomeUruguayUzbekistanVanuatuVenezuela, RBVietnamWest Bank and GazaWorldYemen, Rep.ZambiaZimbabwe Timeline:
This timeline shows a graph from 1961 to 2015 of Iran, Islamic Rep.. No data until 1960. Number of actual observations by date: 55.
Source name:
World Development Indicators
Source organization:
World Bank national accounts data, and OECD National Accounts data files.
Categories, topics:
Economy & Growth
Last updated:
apr 23, 2017
Indicators value changes by year
Maximum:
23.842
jan 1, 1976
At the date of observation
Value
Absolute change
Change from previous value
jan 1, 1961
10.517
+10.517
0.0%
jan 1, 1962
10.467
-0.05
-0.48%
jan 1, 1963
10.278
-0.189
-1.81%
jan 1, 1964
11.111
+0.833
8.11%
jan 1, 1965
12.503
+1.392
12.53%
jan 1, 1966
14.362
+1.859
14.87%
jan 1, 1967
14.829
+0.468
3.26%
jan 1, 1968
15.252
+0.422
2.85%
jan 1, 1969
15.758
+0.507
3.32%
jan 1, 1970
16.722
+0.964
6.12%
jan 1, 1971
17.394
+0.672
4.02%
jan 1, 1972
18.683
+1.289
7.41%
jan 1, 1973
19.226
+0.543
2.91%
jan 1, 1974
17.277
-1.95
-10.14%
jan 1, 1975
21.078
+3.802
22.0%
jan 1, 1976
23.842
+2.764
13.11%
jan 1, 1977
21.433
-2.41
-10.11%
jan 1, 1978
20.345
-1.087
-5.07%
jan 1, 1979
23.322
+2.977
14.63%
jan 1, 1980
19.761
-3.561
-15.27%
jan 1, 1981
21.029
+1.267
6.41%
jan 1, 1982
21.451
+0.423
2.01%
jan 1, 1983
18.485
-2.967
-13.83%
jan 1, 1984
16.236
-2.248
-12.16%
jan 1, 1985
15.113
-1.123
-6.92%
jan 1, 1986
15.905
+0.792
5.24%
jan 1, 1987
15.245
-0.66
-4.15%
jan 1, 1988
14.35
-0.895
-5.87%
jan 1, 1989
15.034
+0.684
4.77%
jan 1, 1990
11.981
-3.053
-20.31%
jan 1, 1991
10.846
-1.134
-9.47%
jan 1, 1992
10.276
-0.57
-5.26%
jan 1, 1993
9.715
-0.562
-5.47%
jan 1, 1994
14.231
+4.516
46.49%
jan 1, 1995
14.354
+0.123
0.86%
jan 1, 1996
14.251
-0.102
-0.71%
jan 1, 1997
12.368
-1.883
-13.22%
jan 1, 1998
11.593
-0.775
-6.27%
jan 1, 1999
13.049
+1.456
12.56%
jan 1, 2000
11.816
-1.233
-9.45%
jan 1, 2001
12.932
+1.116
9.44%
jan 1, 2002
12.872
-0.061
-0.47%
jan 1, 2003
11.717
-1.154
-8.97%
jan 1, 2004
11.42
-0.298
-2.54%
jan 1, 2005
11.94
+0.52
4.56%
jan 1, 2006
12.74
+0.801
6.71%
jan 1, 2007
13.182
+0.441
3.46%
jan 1, 2008
10.042
-3.14
-23.82%
jan 1, 2009
10.602
+0.561
5.58%
jan 1, 2010
11.949
+1.346
12.7%
jan 1, 2011
11.678
-0.271
-2.27%
jan 1, 2012
10.043
-1.635
-14.0%
jan 1, 2013
9.905
-0.138
-1.38%
jan 1, 2014
10.438
+0.534
5.39%
jan 1, 2015
10.704
+0.266
2.54%
Ranking of countries by current statistics by years


Comments: