29
/
en
AIzaSyAYiBZKx7MnpbEhh9jyipgxe19OcubqV5w
April 1, 2024
113594
Cote d'Ivoire
CIV
true
2
1
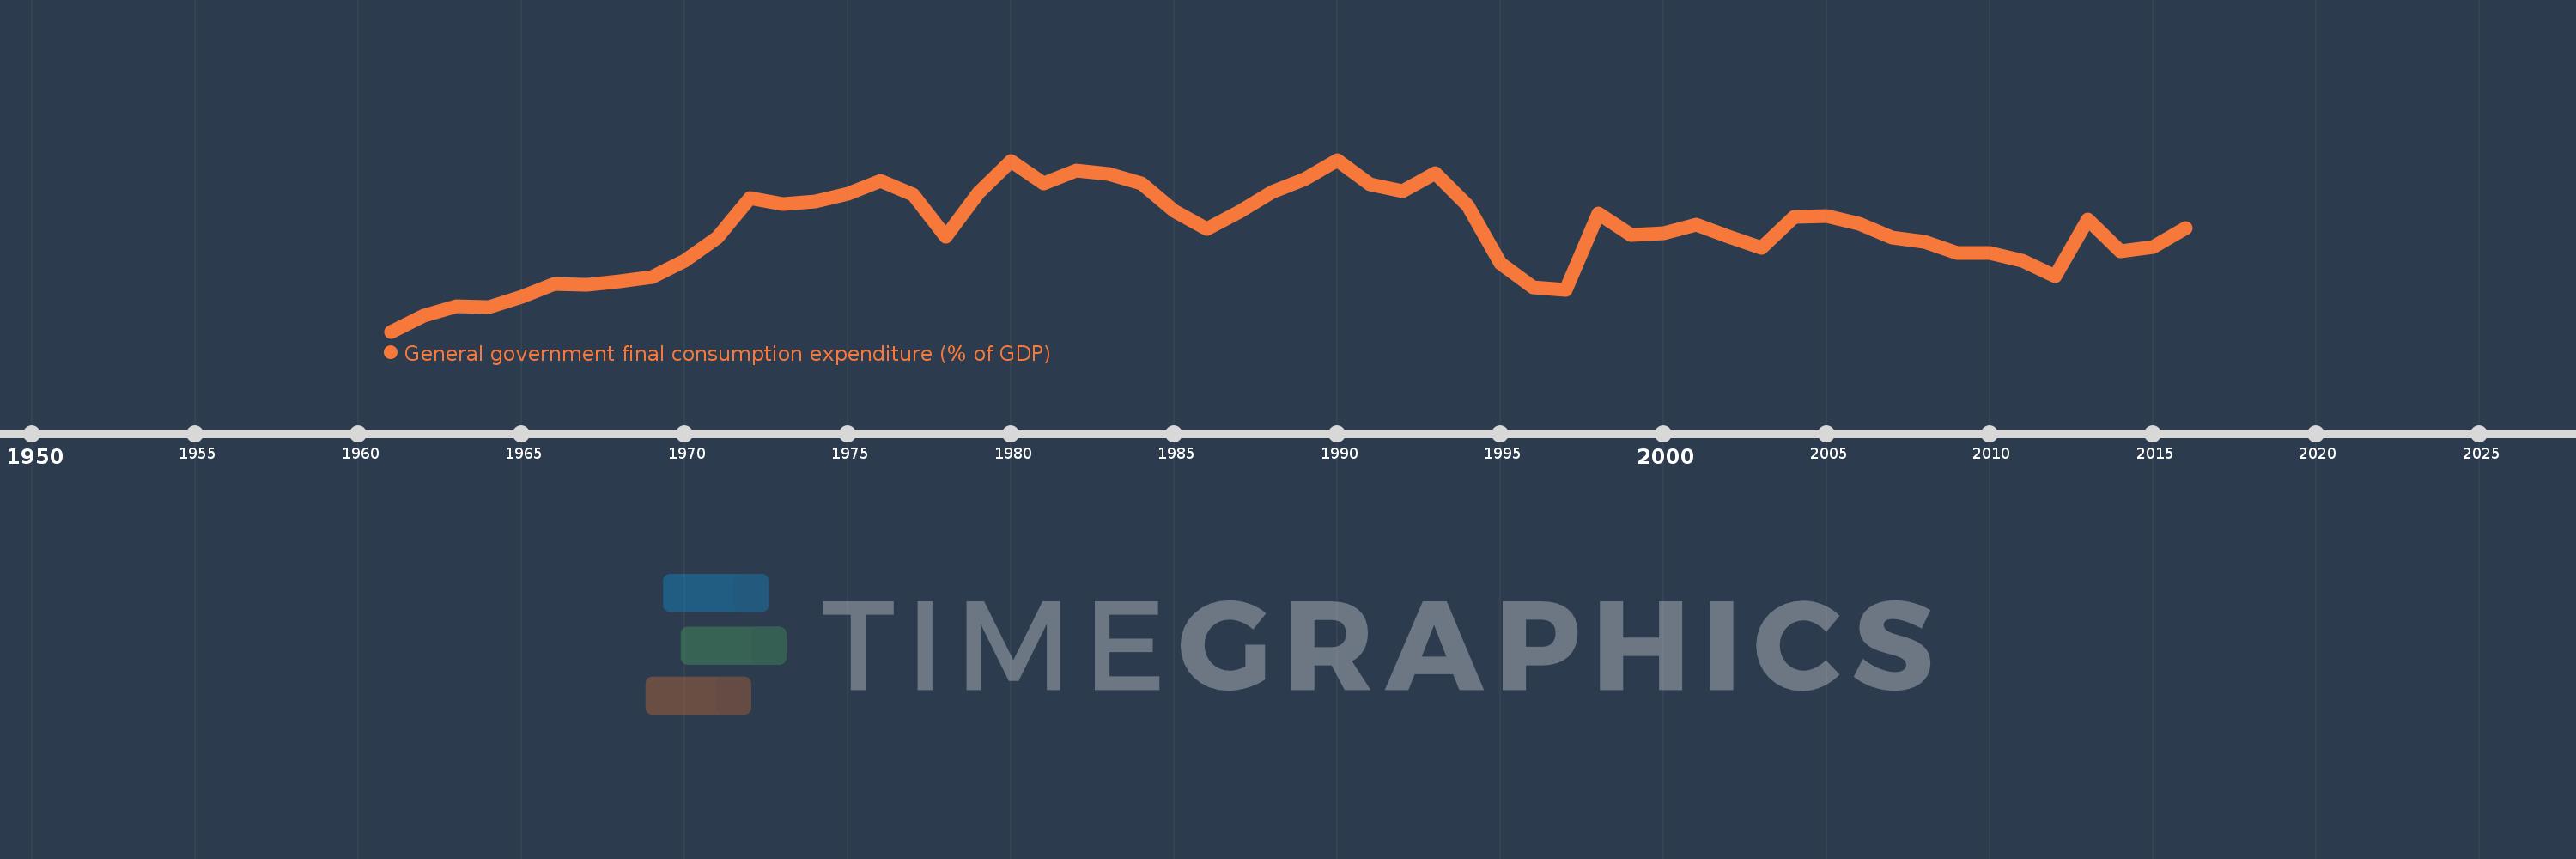
General government final consumption expenditure (% of GDP)
2016,2015,2014,2013,2012,2011,2010,2009,2008,2007,2006,2005,2004,2003,2002,2001,2000,1999,1998,1997,1996,1995,1994,1993,1992,1991,1990,1989,1988,1987,1986,1985,1984,1983,1982,1981,1980,1979,1978,1977,1976,1975,1974,1973,1972,1971,1970,1969,1968,1967,1966,1965,1964,1963,1962,1961
This statistics in other country:
AfghanistanAlbaniaAlgeriaAngolaAntigua and BarbudaArab WorldArgentinaArmeniaArubaAustraliaAustriaAzerbaijanBahamas, TheBahrainBangladeshBarbadosBelarusBelgiumBelizeBeninBermudaBhutanBoliviaBosnia and HerzegovinaBotswanaBrazilBrunei DarussalamBulgariaBurkina FasoBurundiCabo VerdeCambodiaCameroonCanadaCaribbean small statesCentral African RepublicCentral Europe and the BalticsChadChileChinaColombiaComorosCongo, Dem. Rep.Congo, Rep.Costa RicaCote d'IvoireCroatiaCubaCyprusCzech RepublicDenmarkDjiboutiDominicaDominican RepublicEarly-demographic dividendEast Asia & PacificEast Asia & Pacific (excluding high income)East Asia & Pacific (IDA & IBRD countries)EcuadorEgypt, Arab Rep.El SalvadorEquatorial GuineaEritreaEstoniaEthiopiaEuro areaEurope & Central AsiaEurope & Central Asia (excluding high income)Europe & Central Asia (IDA & IBRD countries)European UnionFaroe IslandsFijiFinlandFragile and conflict affected situationsFranceFrench PolynesiaGabonGambia, TheGeorgiaGermanyGhanaGreeceGrenadaGuatemalaGuineaGuinea-BissauGuyanaHaitiHeavily indebted poor countries (HIPC)High incomeHondurasHong Kong SAR, ChinaHungaryIBRD onlyIcelandIDA & IBRD totalIDA blendIDA onlyIDA totalIndiaIndonesiaIran, Islamic Rep.IraqIrelandIsraelItalyJamaicaJapanJordanKazakhstanKenyaKiribatiKorea, Rep.KosovoKuwaitKyrgyz RepublicLao PDRLate-demographic dividendLatin America & Caribbean Latin America & Caribbean (excluding high income)Latin America & the Caribbean (IDA & IBRD countries)LatviaLeast developed countries: UN classificationLebanonLesothoLiberiaLibyaLithuaniaLow & middle incomeLow incomeLower middle incomeLuxembourgMacao SAR, ChinaMacedonia, FYRMadagascarMalawiMalaysiaMaldivesMaliMaltaMauritaniaMauritiusMexicoMicronesia, Fed. Sts.Middle East & North AfricaMiddle East & North Africa (excluding high income)Middle East & North Africa (IDA & IBRD countries)Middle incomeMoldovaMongoliaMontenegroMoroccoMozambiqueNamibiaNepalNetherlandsNew CaledoniaNew ZealandNicaraguaNigerNigeriaNorth AmericaNorwayOECD membersOmanOther small statesPacific island small statesPakistanPanamaPapua New GuineaParaguayPeruPhilippinesPolandPortugalPost-demographic dividendPre-demographic dividendPuerto RicoQatarRomaniaRussian FederationRwandaSaudi ArabiaSenegalSerbiaSeychellesSierra LeoneSingaporeSlovak RepublicSloveniaSmall statesSolomon IslandsSomaliaSouth AfricaSouth AsiaSouth Asia (IDA & IBRD)South SudanSpainSri LankaSt. Kitts and NevisSt. LuciaSt. Vincent and the GrenadinesSub-Saharan Africa Sub-Saharan Africa (excluding high income)Sub-Saharan Africa (IDA & IBRD countries)SudanSurinameSwazilandSwedenSwitzerlandSyrian Arab RepublicTajikistanTanzaniaThailandTimor-LesteTogoTongaTrinidad and TobagoTunisiaTurkeyTurkmenistanUgandaUkraineUnited Arab EmiratesUnited KingdomUnited StatesUpper middle incomeUruguayUzbekistanVanuatuVenezuela, RBVietnamWest Bank and GazaWorldYemen, Rep.ZambiaZimbabwe Timeline:
This timeline shows a graph from 1961 to 2016 of Cote d'Ivoire. No data until 1960. Number of actual observations by date: 56.
Source name:
World Development Indicators
Source organization:
World Bank national accounts data, and OECD National Accounts data files.
Categories, topics:
Economy & Growth
Last updated:
apr 23, 2017
Indicators value changes by year
Maximum:
18.254
jan 1, 1990
At the date of observation
Value
Absolute change
Change from previous value
jan 1, 1961
7.938
+7.938
0.0%
jan 1, 1962
8.871
+0.933
11.76%
jan 1, 1963
9.469
+0.597
6.73%
jan 1, 1964
9.425
-0.044
-0.47%
jan 1, 1965
10.03
+0.605
6.42%
jan 1, 1966
10.781
+0.751
7.48%
jan 1, 1967
10.731
-0.05
-0.46%
jan 1, 1968
10.961
+0.23
2.14%
jan 1, 1969
11.223
+0.262
2.39%
jan 1, 1970
12.207
+0.984
8.76%
jan 1, 1971
13.572
+1.365
11.18%
jan 1, 1972
15.933
+2.361
17.4%
jan 1, 1973
15.597
-0.336
-2.11%
jan 1, 1974
15.757
+0.16
1.03%
jan 1, 1975
16.198
+0.44
2.79%
jan 1, 1976
16.992
+0.795
4.91%
jan 1, 1977
16.185
-0.807
-4.75%
jan 1, 1978
13.624
-2.561
-15.82%
jan 1, 1979
16.289
+2.665
19.56%
jan 1, 1980
18.191
+1.902
11.68%
jan 1, 1981
16.857
-1.335
-7.34%
jan 1, 1982
17.614
+0.757
4.49%
jan 1, 1983
17.393
-0.22
-1.25%
jan 1, 1984
16.859
-0.535
-3.07%
jan 1, 1985
15.163
-1.695
-10.06%
jan 1, 1986
14.087
-1.076
-7.1%
jan 1, 1987
15.128
+1.041
7.39%
jan 1, 1988
16.294
+1.166
7.71%
jan 1, 1989
17.103
+0.808
4.96%
jan 1, 1990
18.254
+1.152
6.73%
jan 1, 1991
16.8
-1.455
-7.97%
jan 1, 1992
16.361
-0.438
-2.61%
jan 1, 1993
17.442
+1.081
6.6%
jan 1, 1994
15.474
-1.967
-11.28%
jan 1, 1995
12.024
-3.45
-22.3%
jan 1, 1996
10.608
-1.416
-11.78%
jan 1, 1997
10.46
-0.148
-1.4%
jan 1, 1998
15.045
+4.585
43.83%
jan 1, 1999
13.718
-1.327
-8.82%
jan 1, 2000
13.844
+0.126
0.92%
jan 1, 2001
14.351
+0.507
3.66%
jan 1, 2002
13.615
-0.736
-5.13%
jan 1, 2003
12.977
-0.638
-4.69%
jan 1, 2004
14.803
+1.826
14.07%
jan 1, 2005
14.895
+0.092
0.62%
jan 1, 2006
14.427
-0.468
-3.14%
jan 1, 2007
13.592
-0.836
-5.79%
jan 1, 2008
13.339
-0.253
-1.86%
jan 1, 2009
12.67
-0.669
-5.01%
jan 1, 2010
12.635
-0.034
-0.27%
jan 1, 2011
12.178
-0.458
-3.62%
jan 1, 2012
11.246
-0.931
-7.65%
jan 1, 2013
14.672
+3.425
30.46%
jan 1, 2014
12.744
-1.928
-13.14%
jan 1, 2015
13.024
+0.28
2.2%
jan 1, 2016
14.162
+1.138
8.74%
Ranking of countries by current statistics by years


Comments: