29
/
en
AIzaSyAYiBZKx7MnpbEhh9jyipgxe19OcubqV5w
April 1, 2024
39921
IDA total
IDA
false
2
1
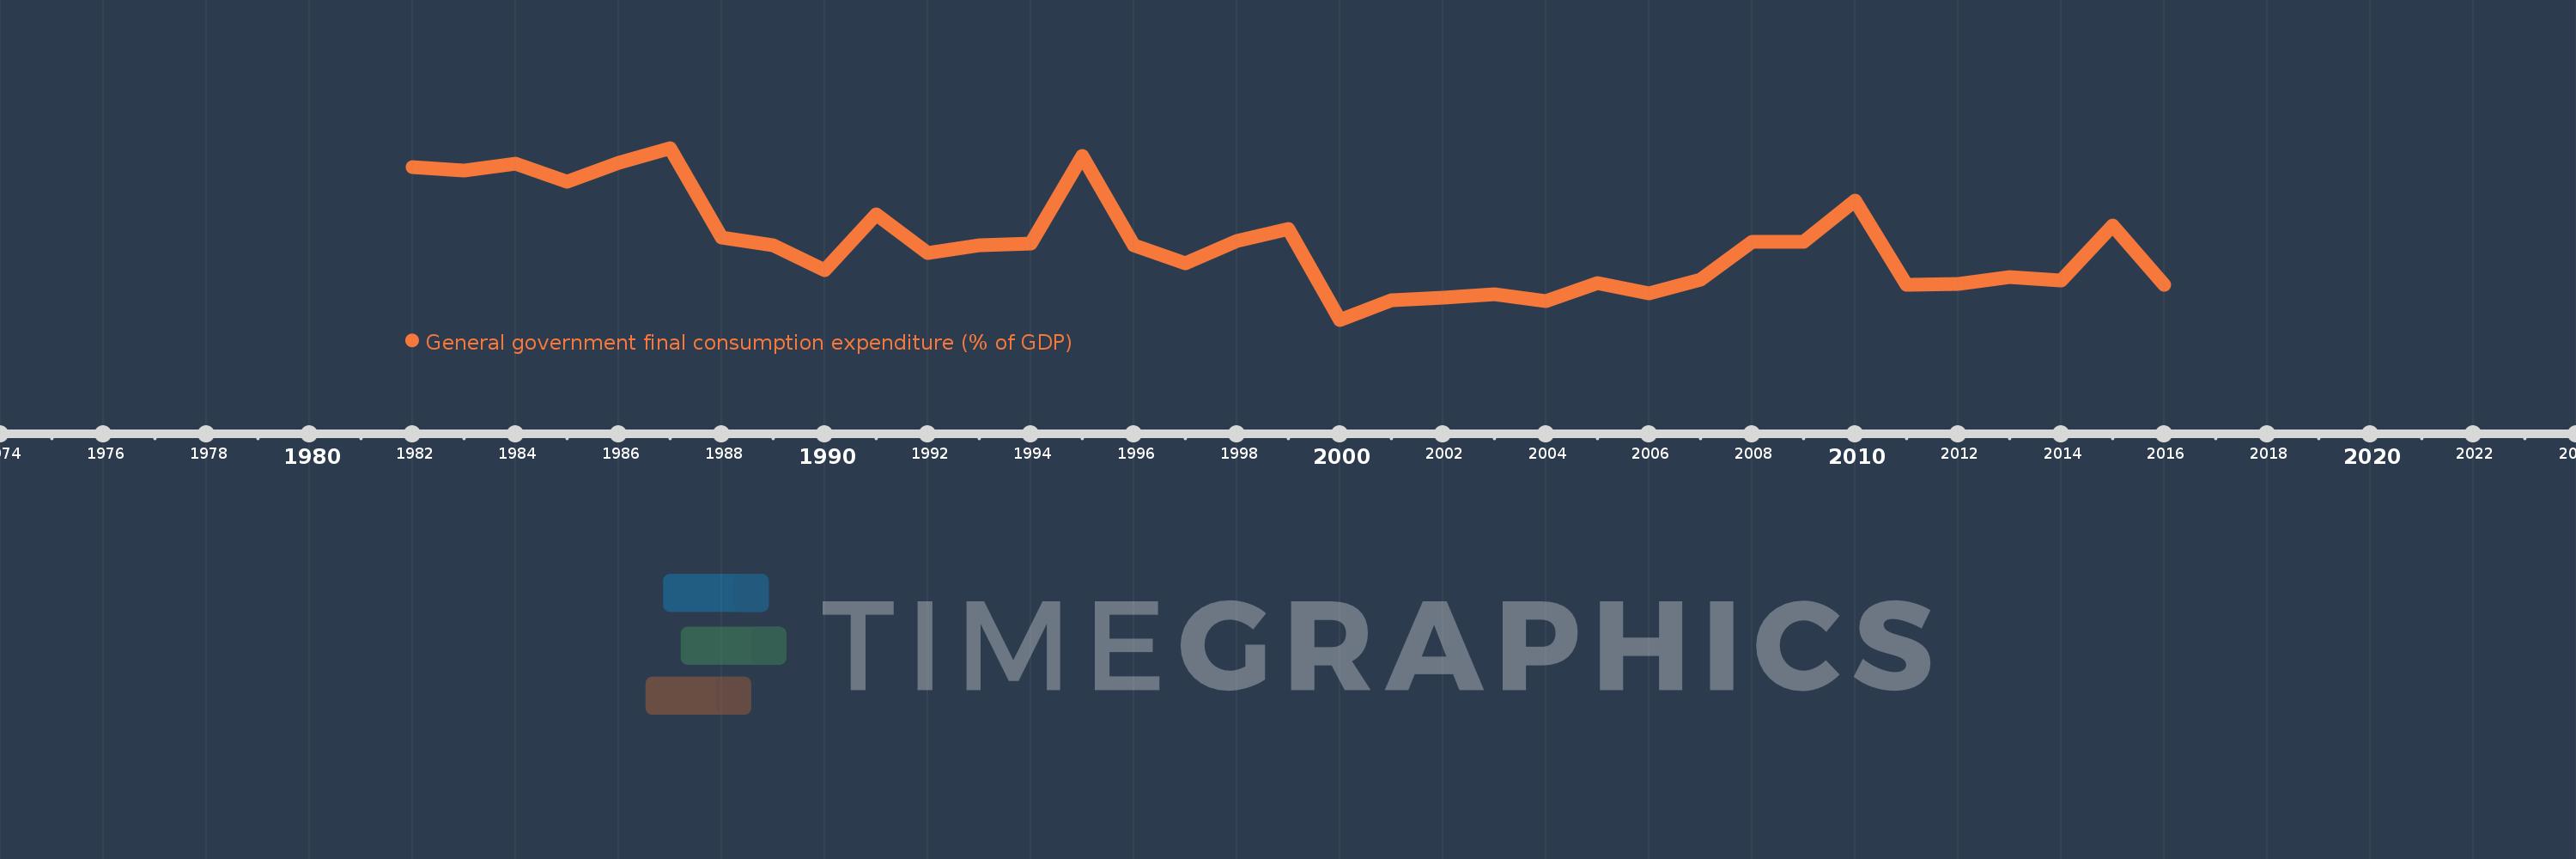
General government final consumption expenditure (% of GDP)
2016,2015,2014,2013,2012,2011,2010,2009,2008,2007,2006,2005,2004,2003,2002,2001,2000,1999,1998,1997,1996,1995,1994,1993,1992,1991,1990,1989,1988,1987,1986,1985,1984,1983,1982
This statistics in other country:
AfghanistanAlbaniaAlgeriaAngolaAntigua and BarbudaArab WorldArgentinaArmeniaArubaAustraliaAustriaAzerbaijanBahamas, TheBahrainBangladeshBarbadosBelarusBelgiumBelizeBeninBermudaBhutanBoliviaBosnia and HerzegovinaBotswanaBrazilBrunei DarussalamBulgariaBurkina FasoBurundiCabo VerdeCambodiaCameroonCanadaCaribbean small statesCentral African RepublicCentral Europe and the BalticsChadChileChinaColombiaComorosCongo, Dem. Rep.Congo, Rep.Costa RicaCote d'IvoireCroatiaCubaCyprusCzech RepublicDenmarkDjiboutiDominicaDominican RepublicEarly-demographic dividendEast Asia & PacificEast Asia & Pacific (excluding high income)East Asia & Pacific (IDA & IBRD countries)EcuadorEgypt, Arab Rep.El SalvadorEquatorial GuineaEritreaEstoniaEthiopiaEuro areaEurope & Central AsiaEurope & Central Asia (excluding high income)Europe & Central Asia (IDA & IBRD countries)European UnionFaroe IslandsFijiFinlandFragile and conflict affected situationsFranceFrench PolynesiaGabonGambia, TheGeorgiaGermanyGhanaGreeceGrenadaGuatemalaGuineaGuinea-BissauGuyanaHaitiHeavily indebted poor countries (HIPC)High incomeHondurasHong Kong SAR, ChinaHungaryIBRD onlyIcelandIDA & IBRD totalIDA blendIDA onlyIDA totalIndiaIndonesiaIran, Islamic Rep.IraqIrelandIsraelItalyJamaicaJapanJordanKazakhstanKenyaKiribatiKorea, Rep.KosovoKuwaitKyrgyz RepublicLao PDRLate-demographic dividendLatin America & Caribbean Latin America & Caribbean (excluding high income)Latin America & the Caribbean (IDA & IBRD countries)LatviaLeast developed countries: UN classificationLebanonLesothoLiberiaLibyaLithuaniaLow & middle incomeLow incomeLower middle incomeLuxembourgMacao SAR, ChinaMacedonia, FYRMadagascarMalawiMalaysiaMaldivesMaliMaltaMauritaniaMauritiusMexicoMicronesia, Fed. Sts.Middle East & North AfricaMiddle East & North Africa (excluding high income)Middle East & North Africa (IDA & IBRD countries)Middle incomeMoldovaMongoliaMontenegroMoroccoMozambiqueNamibiaNepalNetherlandsNew CaledoniaNew ZealandNicaraguaNigerNigeriaNorth AmericaNorwayOECD membersOmanOther small statesPacific island small statesPakistanPanamaPapua New GuineaParaguayPeruPhilippinesPolandPortugalPost-demographic dividendPre-demographic dividendPuerto RicoQatarRomaniaRussian FederationRwandaSaudi ArabiaSenegalSerbiaSeychellesSierra LeoneSingaporeSlovak RepublicSloveniaSmall statesSolomon IslandsSomaliaSouth AfricaSouth AsiaSouth Asia (IDA & IBRD)South SudanSpainSri LankaSt. Kitts and NevisSt. LuciaSt. Vincent and the GrenadinesSub-Saharan Africa Sub-Saharan Africa (excluding high income)Sub-Saharan Africa (IDA & IBRD countries)SudanSurinameSwazilandSwedenSwitzerlandSyrian Arab RepublicTajikistanTanzaniaThailandTimor-LesteTogoTongaTrinidad and TobagoTunisiaTurkeyTurkmenistanUgandaUkraineUnited Arab EmiratesUnited KingdomUnited StatesUpper middle incomeUruguayUzbekistanVanuatuVenezuela, RBVietnamWest Bank and GazaWorldYemen, Rep.ZambiaZimbabwe Timeline:
This timeline shows a graph from 1982 to 2016 of IDA total. No data until 1981. Number of actual observations by date: 35.
Source name:
World Development Indicators
Source organization:
World Bank national accounts data, and OECD National Accounts data files.
Categories, topics:
Economy & Growth
Last updated:
apr 23, 2017
Indicators value changes by year
At the date of observation
Value
Absolute change
Change from previous value
jan 1, 1982
12.559
+12.559
0.0%
jan 1, 1983
12.502
-0.057
-0.46%
jan 1, 1984
12.623
+0.121
0.97%
jan 1, 1985
12.299
-0.324
-2.56%
jan 1, 1986
12.635
+0.335
2.72%
jan 1, 1987
12.89
+0.256
2.03%
jan 1, 1988
11.342
-1.548
-12.01%
jan 1, 1989
11.21
-0.133
-1.17%
jan 1, 1990
10.769
-0.441
-3.93%
jan 1, 1991
11.744
+0.976
9.06%
jan 1, 1992
11.078
-0.667
-5.68%
jan 1, 1993
11.21
+0.132
1.19%
jan 1, 1994
11.23
+0.021
0.18%
jan 1, 1995
12.755
+1.524
13.57%
jan 1, 1996
11.211
-1.544
-12.1%
jan 1, 1997
10.891
-0.32
-2.86%
jan 1, 1998
11.281
+0.39
3.58%
jan 1, 1999
11.493
+0.212
1.88%
jan 1, 2000
9.918
-1.575
-13.71%
jan 1, 2001
10.251
+0.333
3.36%
jan 1, 2002
10.297
+0.047
0.45%
jan 1, 2003
10.357
+0.06
0.58%
jan 1, 2004
10.24
-0.117
-1.13%
jan 1, 2005
10.559
+0.319
3.11%
jan 1, 2006
10.368
-0.19
-1.8%
jan 1, 2007
10.613
+0.244
2.36%
jan 1, 2008
11.272
+0.659
6.21%
jan 1, 2009
11.267
-0.005
-0.05%
jan 1, 2010
11.982
+0.715
6.35%
jan 1, 2011
10.521
-1.461
-12.19%
jan 1, 2012
10.531
+0.01
0.1%
jan 1, 2013
10.658
+0.127
1.21%
jan 1, 2014
10.602
-0.057
-0.53%
jan 1, 2015
11.552
+0.95
8.96%
jan 1, 2016
10.519
-1.033
-8.94%
Ranking of countries by current statistics by years


Comments: