29
/
en
AIzaSyAYiBZKx7MnpbEhh9jyipgxe19OcubqV5w
April 1, 2024
223573
Philippines
PHL
true
2
1
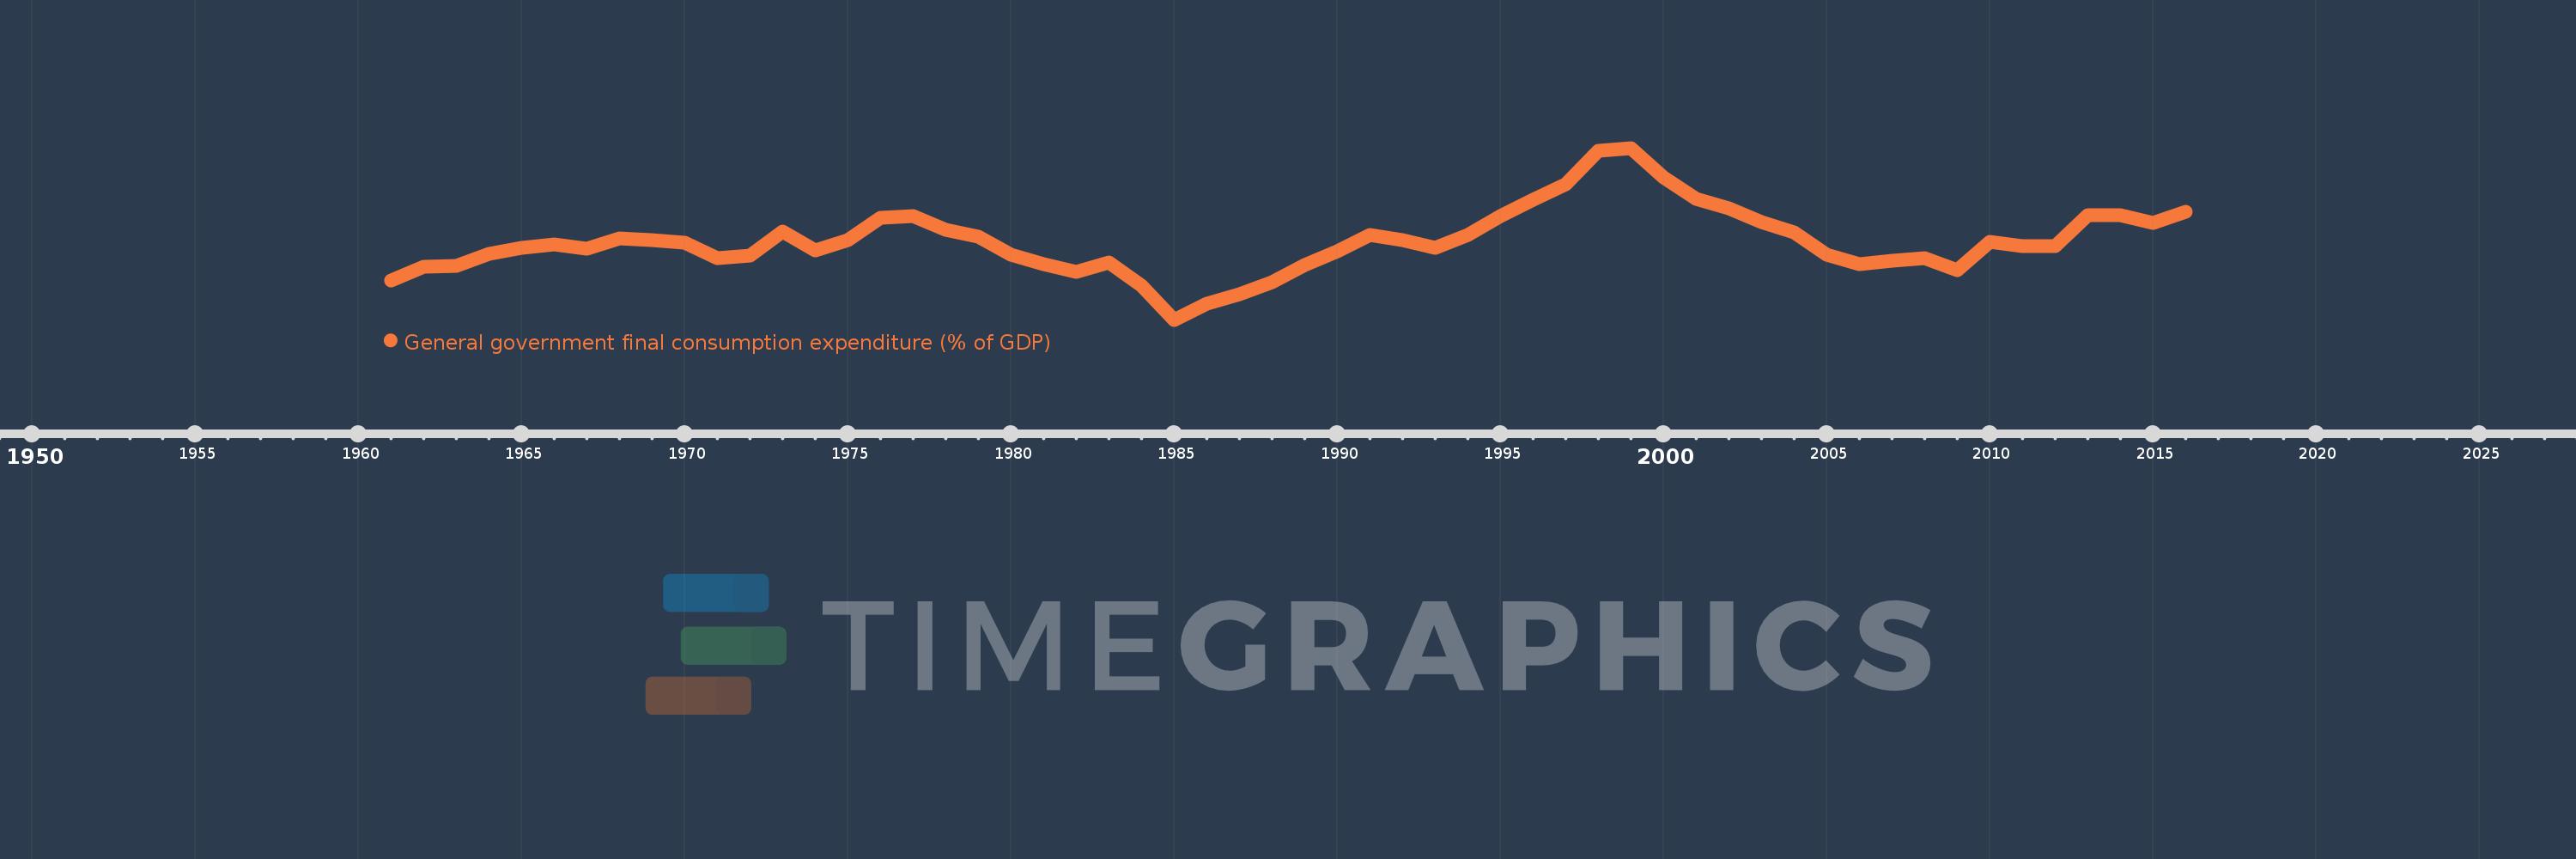
General government final consumption expenditure (% of GDP)
2016,2015,2014,2013,2012,2011,2010,2009,2008,2007,2006,2005,2004,2003,2002,2001,2000,1999,1998,1997,1996,1995,1994,1993,1992,1991,1990,1989,1988,1987,1986,1985,1984,1983,1982,1981,1980,1979,1978,1977,1976,1975,1974,1973,1972,1971,1970,1969,1968,1967,1966,1965,1964,1963,1962,1961
This statistics in other country:
AfghanistanAlbaniaAlgeriaAngolaAntigua and BarbudaArab WorldArgentinaArmeniaArubaAustraliaAustriaAzerbaijanBahamas, TheBahrainBangladeshBarbadosBelarusBelgiumBelizeBeninBermudaBhutanBoliviaBosnia and HerzegovinaBotswanaBrazilBrunei DarussalamBulgariaBurkina FasoBurundiCabo VerdeCambodiaCameroonCanadaCaribbean small statesCentral African RepublicCentral Europe and the BalticsChadChileChinaColombiaComorosCongo, Dem. Rep.Congo, Rep.Costa RicaCote d'IvoireCroatiaCubaCyprusCzech RepublicDenmarkDjiboutiDominicaDominican RepublicEarly-demographic dividendEast Asia & PacificEast Asia & Pacific (excluding high income)East Asia & Pacific (IDA & IBRD countries)EcuadorEgypt, Arab Rep.El SalvadorEquatorial GuineaEritreaEstoniaEthiopiaEuro areaEurope & Central AsiaEurope & Central Asia (excluding high income)Europe & Central Asia (IDA & IBRD countries)European UnionFaroe IslandsFijiFinlandFragile and conflict affected situationsFranceFrench PolynesiaGabonGambia, TheGeorgiaGermanyGhanaGreeceGrenadaGuatemalaGuineaGuinea-BissauGuyanaHaitiHeavily indebted poor countries (HIPC)High incomeHondurasHong Kong SAR, ChinaHungaryIBRD onlyIcelandIDA & IBRD totalIDA blendIDA onlyIDA totalIndiaIndonesiaIran, Islamic Rep.IraqIrelandIsraelItalyJamaicaJapanJordanKazakhstanKenyaKiribatiKorea, Rep.KosovoKuwaitKyrgyz RepublicLao PDRLate-demographic dividendLatin America & Caribbean Latin America & Caribbean (excluding high income)Latin America & the Caribbean (IDA & IBRD countries)LatviaLeast developed countries: UN classificationLebanonLesothoLiberiaLibyaLithuaniaLow & middle incomeLow incomeLower middle incomeLuxembourgMacao SAR, ChinaMacedonia, FYRMadagascarMalawiMalaysiaMaldivesMaliMaltaMauritaniaMauritiusMexicoMicronesia, Fed. Sts.Middle East & North AfricaMiddle East & North Africa (excluding high income)Middle East & North Africa (IDA & IBRD countries)Middle incomeMoldovaMongoliaMontenegroMoroccoMozambiqueNamibiaNepalNetherlandsNew CaledoniaNew ZealandNicaraguaNigerNigeriaNorth AmericaNorwayOECD membersOmanOther small statesPacific island small statesPakistanPanamaPapua New GuineaParaguayPeruPhilippinesPolandPortugalPost-demographic dividendPre-demographic dividendPuerto RicoQatarRomaniaRussian FederationRwandaSaudi ArabiaSenegalSerbiaSeychellesSierra LeoneSingaporeSlovak RepublicSloveniaSmall statesSolomon IslandsSomaliaSouth AfricaSouth AsiaSouth Asia (IDA & IBRD)South SudanSpainSri LankaSt. Kitts and NevisSt. LuciaSt. Vincent and the GrenadinesSub-Saharan Africa Sub-Saharan Africa (excluding high income)Sub-Saharan Africa (IDA & IBRD countries)SudanSurinameSwazilandSwedenSwitzerlandSyrian Arab RepublicTajikistanTanzaniaThailandTimor-LesteTogoTongaTrinidad and TobagoTunisiaTurkeyTurkmenistanUgandaUkraineUnited Arab EmiratesUnited KingdomUnited StatesUpper middle incomeUruguayUzbekistanVanuatuVenezuela, RBVietnamWest Bank and GazaWorldYemen, Rep.ZambiaZimbabwe Timeline:
This timeline shows a graph from 1961 to 2016 of Philippines. No data until 1960. Number of actual observations by date: 56.
Source name:
World Development Indicators
Source organization:
World Bank national accounts data, and OECD National Accounts data files.
Categories, topics:
Economy & Growth
Last updated:
apr 23, 2017
Indicators value changes by year
Maximum:
13.279
jan 1, 1999
At the date of observation
Value
Absolute change
Change from previous value
jan 1, 1961
8.449
+8.449
0.0%
jan 1, 1962
8.948
+0.499
5.91%
jan 1, 1963
9.006
+0.058
0.64%
jan 1, 1964
9.434
+0.428
4.76%
jan 1, 1965
9.655
+0.221
2.34%
jan 1, 1966
9.776
+0.121
1.25%
jan 1, 1967
9.603
-0.173
-1.77%
jan 1, 1968
9.99
+0.387
4.03%
jan 1, 1969
9.918
-0.072
-0.72%
jan 1, 1970
9.845
-0.073
-0.73%
jan 1, 1971
9.277
-0.568
-5.77%
jan 1, 1972
9.352
+0.075
0.81%
jan 1, 1973
10.249
+0.898
9.6%
jan 1, 1974
9.539
-0.711
-6.94%
jan 1, 1975
9.94
+0.401
4.2%
jan 1, 1976
10.737
+0.798
8.03%
jan 1, 1977
10.792
+0.055
0.51%
jan 1, 1978
10.287
-0.505
-4.68%
jan 1, 1979
10.056
-0.232
-2.25%
jan 1, 1980
9.384
-0.671
-6.68%
jan 1, 1981
9.066
-0.318
-3.39%
jan 1, 1982
8.758
-0.309
-3.41%
jan 1, 1983
9.121
+0.363
4.15%
jan 1, 1984
8.278
-0.843
-9.24%
jan 1, 1985
7.032
-1.246
-15.05%
jan 1, 1986
7.61
+0.578
8.22%
jan 1, 1987
7.954
+0.344
4.52%
jan 1, 1988
8.397
+0.443
5.57%
jan 1, 1989
9.032
+0.635
7.56%
jan 1, 1990
9.529
+0.497
5.5%
jan 1, 1991
10.104
+0.575
6.03%
jan 1, 1992
9.927
-0.177
-1.75%
jan 1, 1993
9.657
-0.269
-2.71%
jan 1, 1994
10.109
+0.452
4.68%
jan 1, 1995
10.796
+0.687
6.8%
jan 1, 1996
11.388
+0.591
5.48%
jan 1, 1997
11.948
+0.56
4.92%
jan 1, 1998
13.184
+1.236
10.34%
jan 1, 1999
13.279
+0.095
0.72%
jan 1, 2000
12.219
-1.06
-7.98%
jan 1, 2001
11.424
-0.795
-6.51%
jan 1, 2002
11.08
-0.343
-3.01%
jan 1, 2003
10.574
-0.507
-4.57%
jan 1, 2004
10.202
-0.371
-3.51%
jan 1, 2005
9.382
-0.82
-8.04%
jan 1, 2006
9.04
-0.343
-3.65%
jan 1, 2007
9.18
+0.141
1.56%
jan 1, 2008
9.285
+0.105
1.14%
jan 1, 2009
8.832
-0.453
-4.88%
jan 1, 2010
9.86
+1.029
11.65%
jan 1, 2011
9.722
-0.139
-1.41%
jan 1, 2012
9.701
-0.02
-0.21%
jan 1, 2013
10.843
+1.142
11.77%
jan 1, 2014
10.84
-0.003
-0.02%
jan 1, 2015
10.549
-0.291
-2.69%
jan 1, 2016
10.959
+0.41
3.88%
Ranking of countries by current statistics by years


Comments: