29
/
en
AIzaSyAYiBZKx7MnpbEhh9jyipgxe19OcubqV5w
April 1, 2024
269338
Turkey
TUR
true
2
1
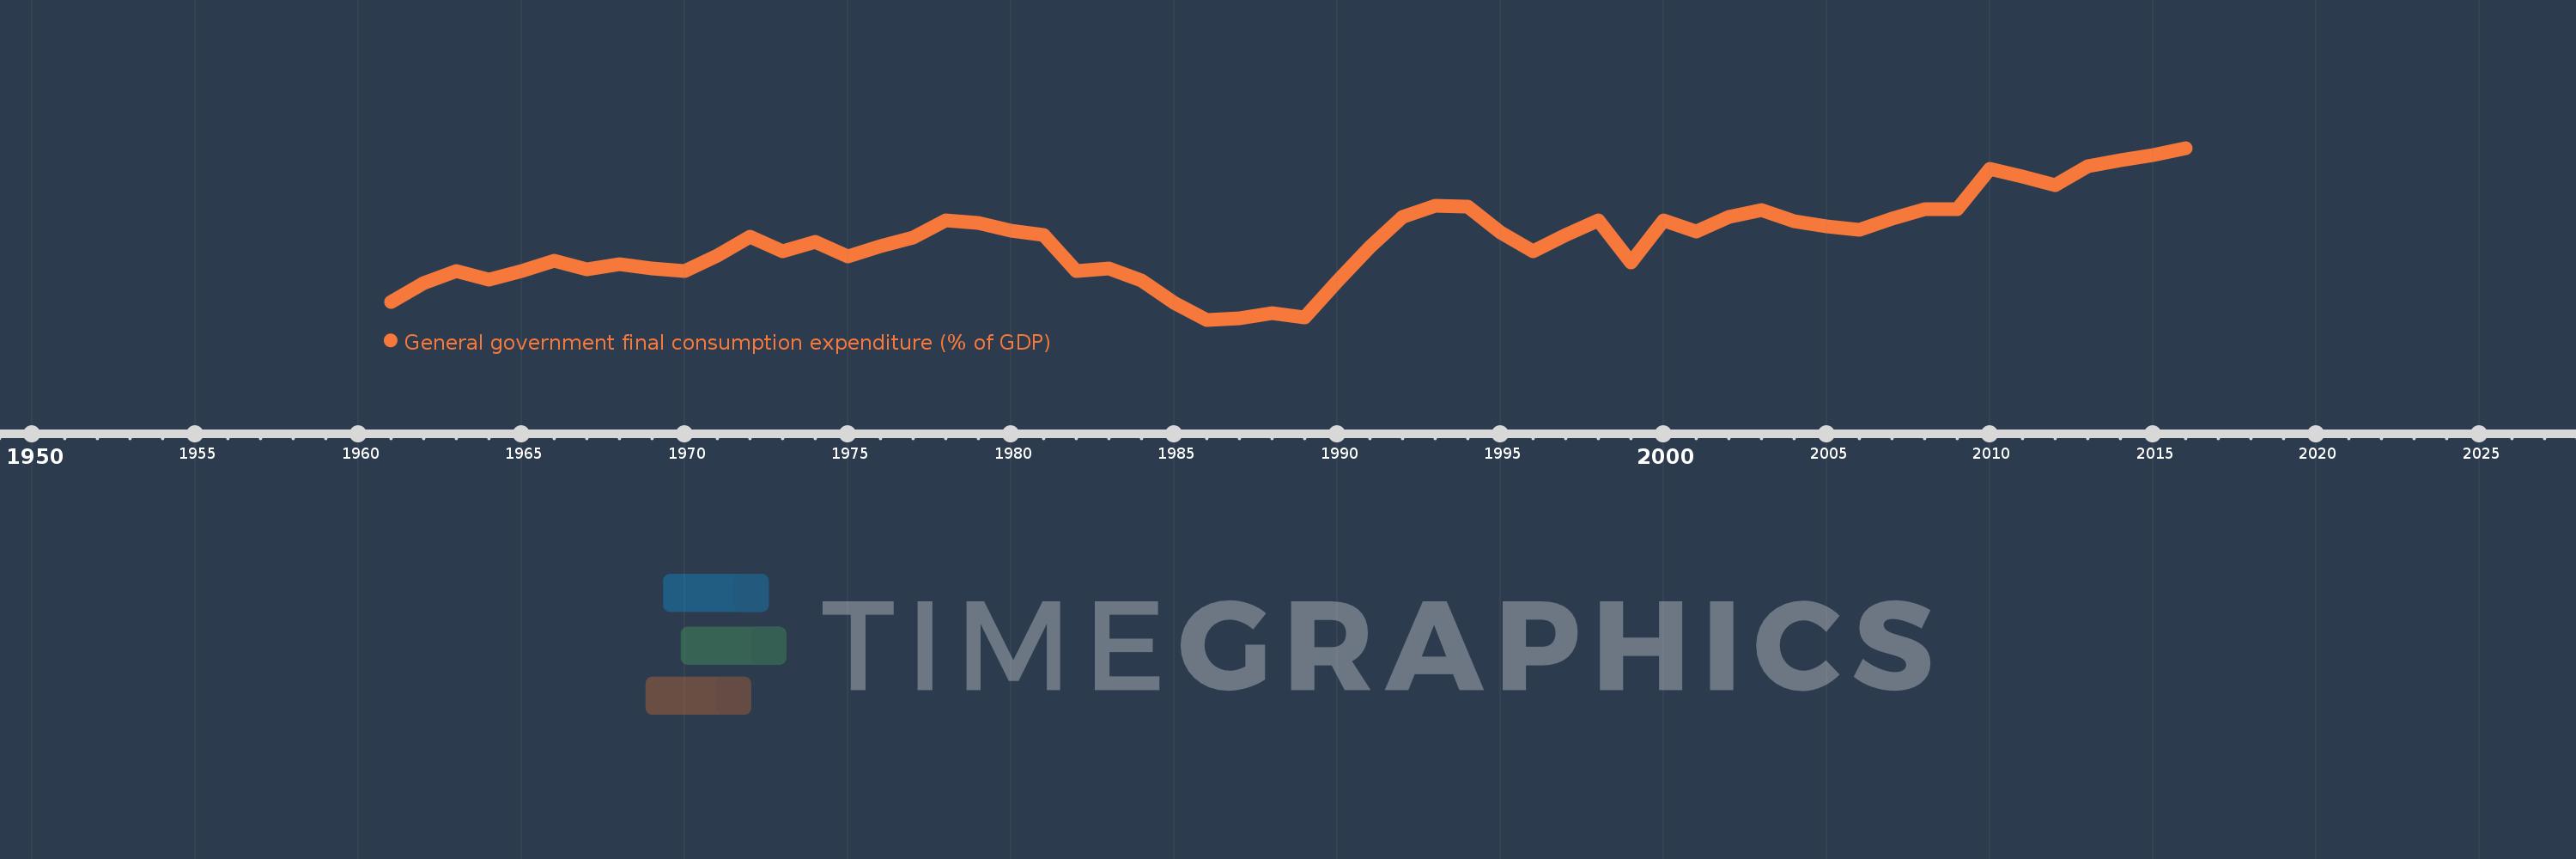
General government final consumption expenditure (% of GDP)
2016,2015,2014,2013,2012,2011,2010,2009,2008,2007,2006,2005,2004,2003,2002,2001,2000,1999,1998,1997,1996,1995,1994,1993,1992,1991,1990,1989,1988,1987,1986,1985,1984,1983,1982,1981,1980,1979,1978,1977,1976,1975,1974,1973,1972,1971,1970,1969,1968,1967,1966,1965,1964,1963,1962,1961
This statistics in other country:
AfghanistanAlbaniaAlgeriaAngolaAntigua and BarbudaArab WorldArgentinaArmeniaArubaAustraliaAustriaAzerbaijanBahamas, TheBahrainBangladeshBarbadosBelarusBelgiumBelizeBeninBermudaBhutanBoliviaBosnia and HerzegovinaBotswanaBrazilBrunei DarussalamBulgariaBurkina FasoBurundiCabo VerdeCambodiaCameroonCanadaCaribbean small statesCentral African RepublicCentral Europe and the BalticsChadChileChinaColombiaComorosCongo, Dem. Rep.Congo, Rep.Costa RicaCote d'IvoireCroatiaCubaCyprusCzech RepublicDenmarkDjiboutiDominicaDominican RepublicEarly-demographic dividendEast Asia & PacificEast Asia & Pacific (excluding high income)East Asia & Pacific (IDA & IBRD countries)EcuadorEgypt, Arab Rep.El SalvadorEquatorial GuineaEritreaEstoniaEthiopiaEuro areaEurope & Central AsiaEurope & Central Asia (excluding high income)Europe & Central Asia (IDA & IBRD countries)European UnionFaroe IslandsFijiFinlandFragile and conflict affected situationsFranceFrench PolynesiaGabonGambia, TheGeorgiaGermanyGhanaGreeceGrenadaGuatemalaGuineaGuinea-BissauGuyanaHaitiHeavily indebted poor countries (HIPC)High incomeHondurasHong Kong SAR, ChinaHungaryIBRD onlyIcelandIDA & IBRD totalIDA blendIDA onlyIDA totalIndiaIndonesiaIran, Islamic Rep.IraqIrelandIsraelItalyJamaicaJapanJordanKazakhstanKenyaKiribatiKorea, Rep.KosovoKuwaitKyrgyz RepublicLao PDRLate-demographic dividendLatin America & Caribbean Latin America & Caribbean (excluding high income)Latin America & the Caribbean (IDA & IBRD countries)LatviaLeast developed countries: UN classificationLebanonLesothoLiberiaLibyaLithuaniaLow & middle incomeLow incomeLower middle incomeLuxembourgMacao SAR, ChinaMacedonia, FYRMadagascarMalawiMalaysiaMaldivesMaliMaltaMauritaniaMauritiusMexicoMicronesia, Fed. Sts.Middle East & North AfricaMiddle East & North Africa (excluding high income)Middle East & North Africa (IDA & IBRD countries)Middle incomeMoldovaMongoliaMontenegroMoroccoMozambiqueNamibiaNepalNetherlandsNew CaledoniaNew ZealandNicaraguaNigerNigeriaNorth AmericaNorwayOECD membersOmanOther small statesPacific island small statesPakistanPanamaPapua New GuineaParaguayPeruPhilippinesPolandPortugalPost-demographic dividendPre-demographic dividendPuerto RicoQatarRomaniaRussian FederationRwandaSaudi ArabiaSenegalSerbiaSeychellesSierra LeoneSingaporeSlovak RepublicSloveniaSmall statesSolomon IslandsSomaliaSouth AfricaSouth AsiaSouth Asia (IDA & IBRD)South SudanSpainSri LankaSt. Kitts and NevisSt. LuciaSt. Vincent and the GrenadinesSub-Saharan Africa Sub-Saharan Africa (excluding high income)Sub-Saharan Africa (IDA & IBRD countries)SudanSurinameSwazilandSwedenSwitzerlandSyrian Arab RepublicTajikistanTanzaniaThailandTimor-LesteTogoTongaTrinidad and TobagoTunisiaTurkeyTurkmenistanUgandaUkraineUnited Arab EmiratesUnited KingdomUnited StatesUpper middle incomeUruguayUzbekistanVanuatuVenezuela, RBVietnamWest Bank and GazaWorldYemen, Rep.ZambiaZimbabwe Timeline:
This timeline shows a graph from 1961 to 2016 of Turkey. No data until 1960. Number of actual observations by date: 56.
Source name:
World Development Indicators
Source organization:
World Bank national accounts data, and OECD National Accounts data files.
Categories, topics:
Economy & Growth
Last updated:
apr 23, 2017
Indicators value changes by year
Maximum:
15.698
jan 1, 2016
At the date of observation
Value
Absolute change
Change from previous value
jan 1, 1961
8.37
+8.37
0.0%
jan 1, 1962
9.28
+0.91
10.87%
jan 1, 1963
9.838
+0.558
6.02%
jan 1, 1964
9.442
-0.396
-4.03%
jan 1, 1965
9.841
+0.399
4.22%
jan 1, 1966
10.326
+0.485
4.92%
jan 1, 1967
9.913
-0.412
-3.99%
jan 1, 1968
10.142
+0.228
2.3%
jan 1, 1969
9.968
-0.174
-1.71%
jan 1, 1970
9.817
-0.151
-1.51%
jan 1, 1971
10.585
+0.768
7.82%
jan 1, 1972
11.464
+0.879
8.3%
jan 1, 1973
10.758
-0.706
-6.16%
jan 1, 1974
11.236
+0.479
4.45%
jan 1, 1975
10.528
-0.708
-6.3%
jan 1, 1976
11.015
+0.486
4.62%
jan 1, 1977
11.419
+0.404
3.67%
jan 1, 1978
12.231
+0.813
7.12%
jan 1, 1979
12.125
-0.107
-0.87%
jan 1, 1980
11.749
-0.376
-3.1%
jan 1, 1981
11.553
-0.196
-1.67%
jan 1, 1982
9.841
-1.713
-14.82%
jan 1, 1983
9.944
+0.103
1.05%
jan 1, 1984
9.388
-0.555
-5.59%
jan 1, 1985
8.336
-1.053
-11.21%
jan 1, 1986
7.515
-0.82
-9.84%
jan 1, 1987
7.588
+0.073
0.96%
jan 1, 1988
7.823
+0.235
3.1%
jan 1, 1989
7.613
-0.21
-2.69%
jan 1, 1990
9.343
+1.731
22.73%
jan 1, 1991
10.961
+1.618
17.31%
jan 1, 1992
12.419
+1.458
13.3%
jan 1, 1993
12.925
+0.506
4.07%
jan 1, 1994
12.894
-0.031
-0.24%
jan 1, 1995
11.657
-1.236
-9.59%
jan 1, 1996
10.786
-0.872
-7.48%
jan 1, 1997
11.571
+0.785
7.28%
jan 1, 1998
12.259
+0.689
5.95%
jan 1, 1999
10.253
-2.007
-16.37%
jan 1, 2000
12.229
+1.976
19.28%
jan 1, 2001
11.726
-0.503
-4.11%
jan 1, 2002
12.396
+0.67
5.71%
jan 1, 2003
12.73
+0.334
2.69%
jan 1, 2004
12.2
-0.53
-4.16%
jan 1, 2005
11.95
-0.25
-2.05%
jan 1, 2006
11.788
-0.161
-1.35%
jan 1, 2007
12.332
+0.544
4.61%
jan 1, 2008
12.787
+0.455
3.69%
jan 1, 2009
12.801
+0.014
0.11%
jan 1, 2010
14.7
+1.899
14.83%
jan 1, 2011
14.335
-0.365
-2.48%
jan 1, 2012
13.925
-0.41
-2.86%
jan 1, 2013
14.844
+0.919
6.6%
jan 1, 2014
15.095
+0.251
1.69%
jan 1, 2015
15.339
+0.244
1.62%
jan 1, 2016
15.698
+0.359
2.34%
Ranking of countries by current statistics by years


Comments: