29
/
en
AIzaSyAYiBZKx7MnpbEhh9jyipgxe19OcubqV5w
April 1, 2024
50026
Middle East & North Africa (IDA & IBRD countries)
TMN
false
2
1
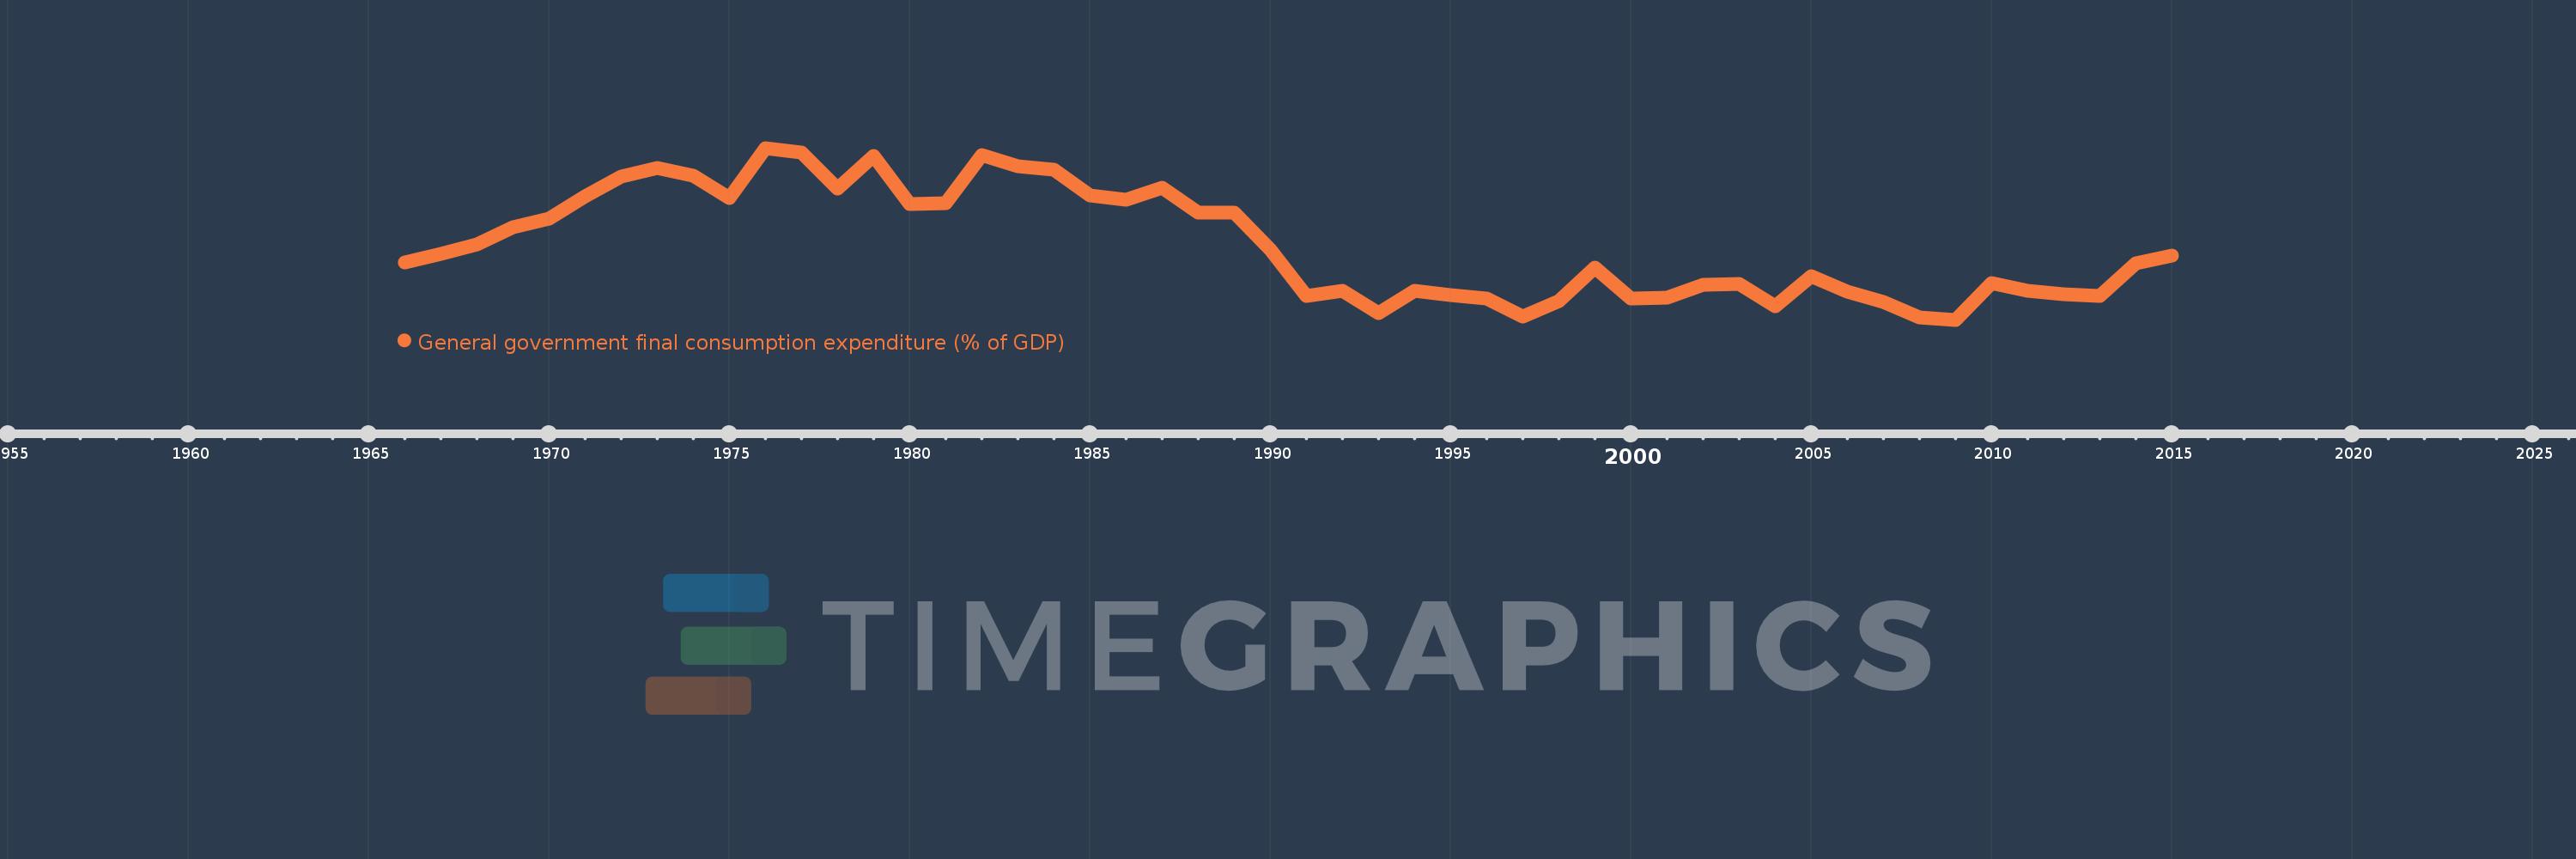
General government final consumption expenditure (% of GDP)
2015,2014,2013,2012,2011,2010,2009,2008,2007,2006,2005,2004,2003,2002,2001,2000,1999,1998,1997,1996,1995,1994,1993,1992,1991,1990,1989,1988,1987,1986,1985,1984,1983,1982,1981,1980,1979,1978,1977,1976,1975,1974,1973,1972,1971,1970,1969,1968,1967,1966
This statistics in other country:
AfghanistanAlbaniaAlgeriaAngolaAntigua and BarbudaArab WorldArgentinaArmeniaArubaAustraliaAustriaAzerbaijanBahamas, TheBahrainBangladeshBarbadosBelarusBelgiumBelizeBeninBermudaBhutanBoliviaBosnia and HerzegovinaBotswanaBrazilBrunei DarussalamBulgariaBurkina FasoBurundiCabo VerdeCambodiaCameroonCanadaCaribbean small statesCentral African RepublicCentral Europe and the BalticsChadChileChinaColombiaComorosCongo, Dem. Rep.Congo, Rep.Costa RicaCote d'IvoireCroatiaCubaCyprusCzech RepublicDenmarkDjiboutiDominicaDominican RepublicEarly-demographic dividendEast Asia & PacificEast Asia & Pacific (excluding high income)East Asia & Pacific (IDA & IBRD countries)EcuadorEgypt, Arab Rep.El SalvadorEquatorial GuineaEritreaEstoniaEthiopiaEuro areaEurope & Central AsiaEurope & Central Asia (excluding high income)Europe & Central Asia (IDA & IBRD countries)European UnionFaroe IslandsFijiFinlandFragile and conflict affected situationsFranceFrench PolynesiaGabonGambia, TheGeorgiaGermanyGhanaGreeceGrenadaGuatemalaGuineaGuinea-BissauGuyanaHaitiHeavily indebted poor countries (HIPC)High incomeHondurasHong Kong SAR, ChinaHungaryIBRD onlyIcelandIDA & IBRD totalIDA blendIDA onlyIDA totalIndiaIndonesiaIran, Islamic Rep.IraqIrelandIsraelItalyJamaicaJapanJordanKazakhstanKenyaKiribatiKorea, Rep.KosovoKuwaitKyrgyz RepublicLao PDRLate-demographic dividendLatin America & Caribbean Latin America & Caribbean (excluding high income)Latin America & the Caribbean (IDA & IBRD countries)LatviaLeast developed countries: UN classificationLebanonLesothoLiberiaLibyaLithuaniaLow & middle incomeLow incomeLower middle incomeLuxembourgMacao SAR, ChinaMacedonia, FYRMadagascarMalawiMalaysiaMaldivesMaliMaltaMauritaniaMauritiusMexicoMicronesia, Fed. Sts.Middle East & North AfricaMiddle East & North Africa (excluding high income)Middle East & North Africa (IDA & IBRD countries)Middle incomeMoldovaMongoliaMontenegroMoroccoMozambiqueNamibiaNepalNetherlandsNew CaledoniaNew ZealandNicaraguaNigerNigeriaNorth AmericaNorwayOECD membersOmanOther small statesPacific island small statesPakistanPanamaPapua New GuineaParaguayPeruPhilippinesPolandPortugalPost-demographic dividendPre-demographic dividendPuerto RicoQatarRomaniaRussian FederationRwandaSaudi ArabiaSenegalSerbiaSeychellesSierra LeoneSingaporeSlovak RepublicSloveniaSmall statesSolomon IslandsSomaliaSouth AfricaSouth AsiaSouth Asia (IDA & IBRD)South SudanSpainSri LankaSt. Kitts and NevisSt. LuciaSt. Vincent and the GrenadinesSub-Saharan Africa Sub-Saharan Africa (excluding high income)Sub-Saharan Africa (IDA & IBRD countries)SudanSurinameSwazilandSwedenSwitzerlandSyrian Arab RepublicTajikistanTanzaniaThailandTimor-LesteTogoTongaTrinidad and TobagoTunisiaTurkeyTurkmenistanUgandaUkraineUnited Arab EmiratesUnited KingdomUnited StatesUpper middle incomeUruguayUzbekistanVanuatuVenezuela, RBVietnamWest Bank and GazaWorldYemen, Rep.ZambiaZimbabwe Timeline:
This timeline shows a graph from 1966 to 2015 of Middle East & North Africa (IDA & IBRD countries). No data until 1965. Number of actual observations by date: 50.
Source name:
World Development Indicators
Source organization:
World Bank national accounts data, and OECD National Accounts data files.
Categories, topics:
Economy & Growth
Last updated:
apr 23, 2017
Indicators value changes by year
Maximum:
21.218
jan 1, 1976
At the date of observation
Value
Absolute change
Change from previous value
jan 1, 1966
15.483
+15.483
0.0%
jan 1, 1967
15.928
+0.444
2.87%
jan 1, 1968
16.383
+0.456
2.86%
jan 1, 1969
17.25
+0.866
5.29%
jan 1, 1970
17.702
+0.452
2.62%
jan 1, 1971
18.803
+1.101
6.22%
jan 1, 1972
19.8
+0.997
5.3%
jan 1, 1973
20.2
+0.4
2.02%
jan 1, 1974
19.852
-0.348
-1.72%
jan 1, 1975
18.704
-1.148
-5.78%
jan 1, 1976
21.218
+2.513
13.44%
jan 1, 1977
20.988
-0.23
-1.08%
jan 1, 1978
19.172
-1.816
-8.65%
jan 1, 1979
20.828
+1.656
8.64%
jan 1, 1980
18.43
-2.398
-11.51%
jan 1, 1981
18.44
+0.011
0.06%
jan 1, 1982
20.871
+2.431
13.18%
jan 1, 1983
20.284
-0.588
-2.82%
jan 1, 1984
20.132
-0.152
-0.75%
jan 1, 1985
18.845
-1.287
-6.39%
jan 1, 1986
18.612
-0.233
-1.24%
jan 1, 1987
19.22
+0.607
3.26%
jan 1, 1988
17.989
-1.23
-6.4%
jan 1, 1989
17.971
-0.018
-0.1%
jan 1, 1990
16.15
-1.821
-10.13%
jan 1, 1991
13.82
-2.33
-14.43%
jan 1, 1992
14.082
+0.262
1.89%
jan 1, 1993
12.985
-1.096
-7.79%
jan 1, 1994
14.088
+1.103
8.49%
jan 1, 1995
13.857
-0.231
-1.64%
jan 1, 1996
13.689
-0.169
-1.22%
jan 1, 1997
12.799
-0.89
-6.5%
jan 1, 1998
13.583
+0.784
6.13%
jan 1, 1999
15.251
+1.668
12.28%
jan 1, 2000
13.68
-1.571
-10.3%
jan 1, 2001
13.761
+0.081
0.59%
jan 1, 2002
14.37
+0.609
4.42%
jan 1, 2003
14.424
+0.054
0.38%
jan 1, 2004
13.334
-1.09
-7.56%
jan 1, 2005
14.827
+1.493
11.2%
jan 1, 2006
14.041
-0.786
-5.3%
jan 1, 2007
13.512
-0.529
-3.77%
jan 1, 2008
12.757
-0.756
-5.59%
jan 1, 2009
12.64
-0.116
-0.91%
jan 1, 2010
14.474
+1.833
14.5%
jan 1, 2011
14.097
-0.377
-2.6%
jan 1, 2012
13.911
-0.186
-1.32%
jan 1, 2013
13.845
-0.066
-0.47%
jan 1, 2014
15.47
+1.626
11.74%
jan 1, 2015
15.846
+0.376
2.43%
Ranking of countries by current statistics by years


Comments: