29
/
en
AIzaSyAYiBZKx7MnpbEhh9jyipgxe19OcubqV5w
April 1, 2024
91154
Brazil
BRA
true
2
1
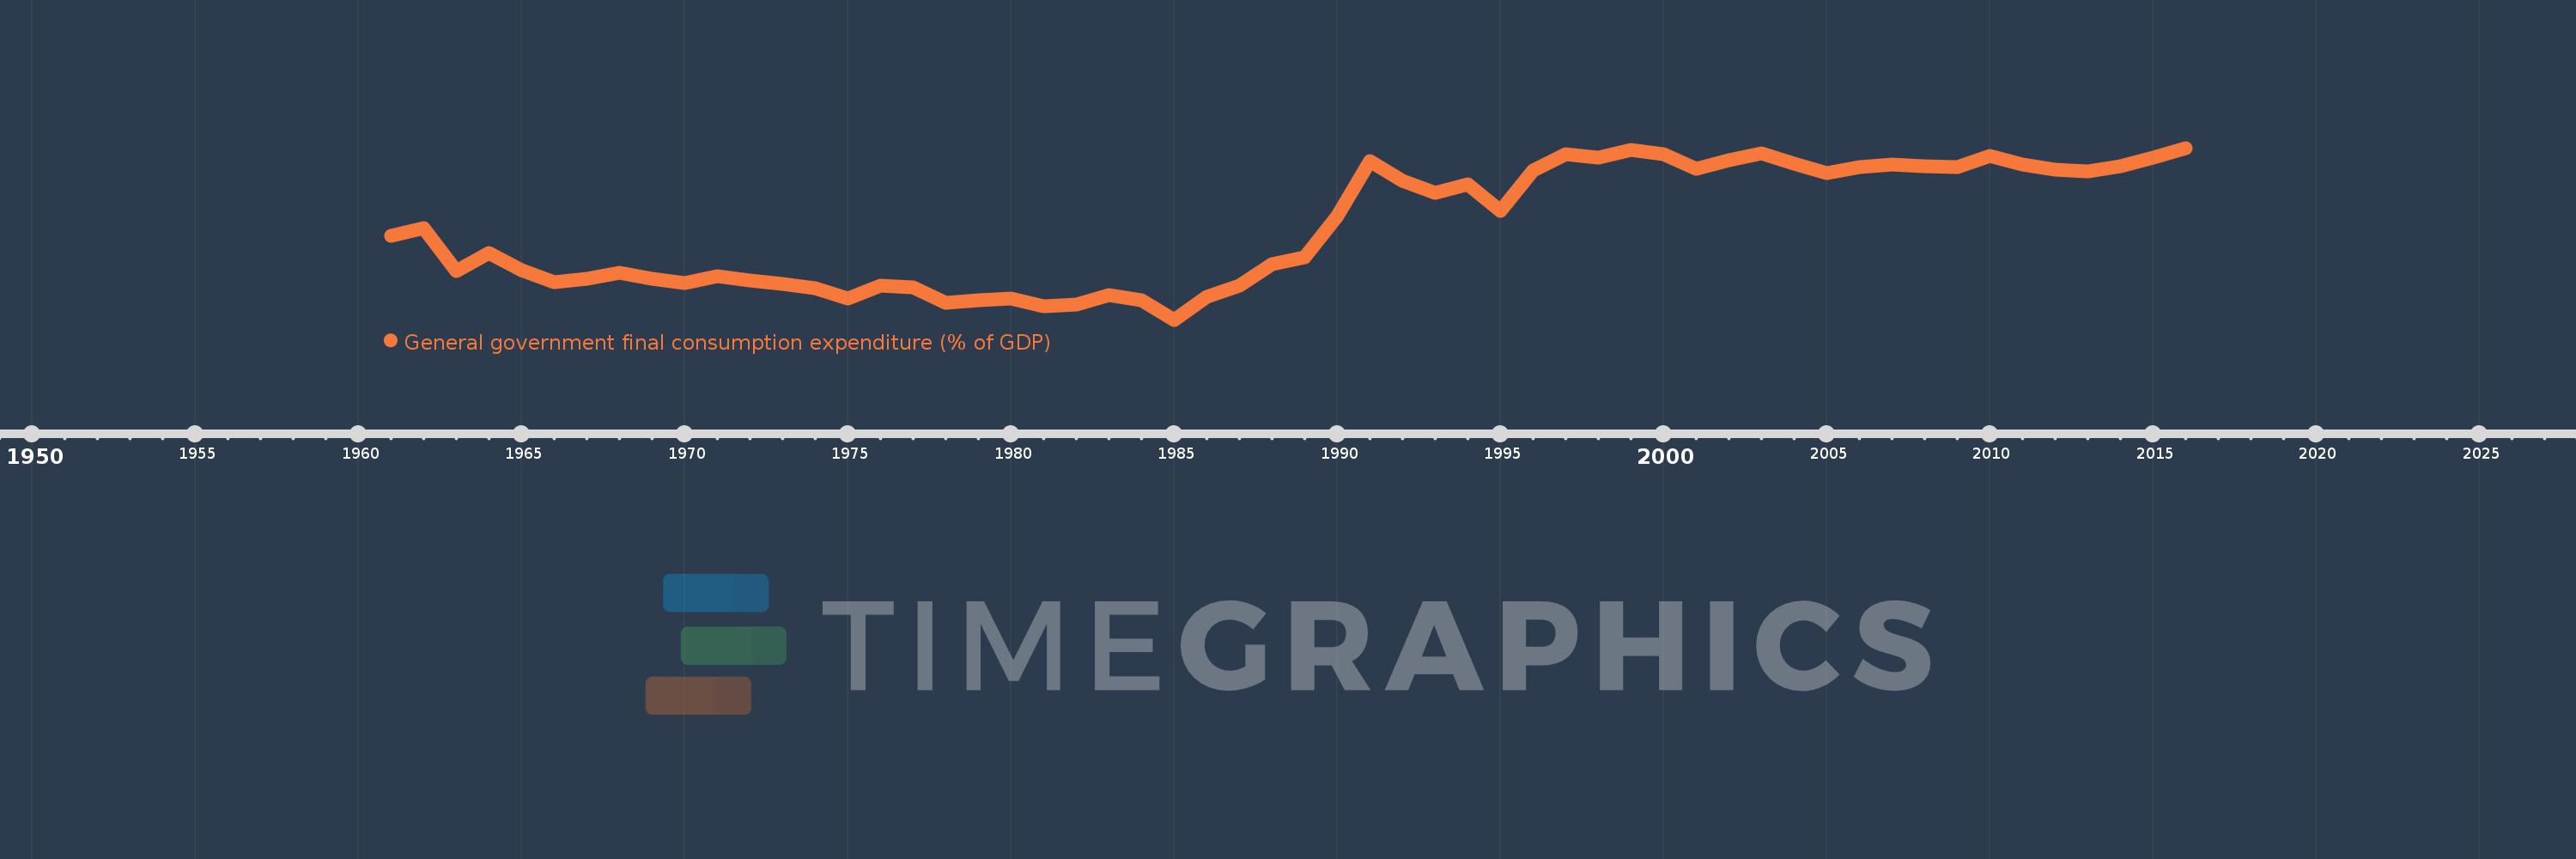
General government final consumption expenditure (% of GDP)
2016,2015,2014,2013,2012,2011,2010,2009,2008,2007,2006,2005,2004,2003,2002,2001,2000,1999,1998,1997,1996,1995,1994,1993,1992,1991,1990,1989,1988,1987,1986,1985,1984,1983,1982,1981,1980,1979,1978,1977,1976,1975,1974,1973,1972,1971,1970,1969,1968,1967,1966,1965,1964,1963,1962,1961
This statistics in other country:
AfghanistanAlbaniaAlgeriaAngolaAntigua and BarbudaArab WorldArgentinaArmeniaArubaAustraliaAustriaAzerbaijanBahamas, TheBahrainBangladeshBarbadosBelarusBelgiumBelizeBeninBermudaBhutanBoliviaBosnia and HerzegovinaBotswanaBrazilBrunei DarussalamBulgariaBurkina FasoBurundiCabo VerdeCambodiaCameroonCanadaCaribbean small statesCentral African RepublicCentral Europe and the BalticsChadChileChinaColombiaComorosCongo, Dem. Rep.Congo, Rep.Costa RicaCote d'IvoireCroatiaCubaCyprusCzech RepublicDenmarkDjiboutiDominicaDominican RepublicEarly-demographic dividendEast Asia & PacificEast Asia & Pacific (excluding high income)East Asia & Pacific (IDA & IBRD countries)EcuadorEgypt, Arab Rep.El SalvadorEquatorial GuineaEritreaEstoniaEthiopiaEuro areaEurope & Central AsiaEurope & Central Asia (excluding high income)Europe & Central Asia (IDA & IBRD countries)European UnionFaroe IslandsFijiFinlandFragile and conflict affected situationsFranceFrench PolynesiaGabonGambia, TheGeorgiaGermanyGhanaGreeceGrenadaGuatemalaGuineaGuinea-BissauGuyanaHaitiHeavily indebted poor countries (HIPC)High incomeHondurasHong Kong SAR, ChinaHungaryIBRD onlyIcelandIDA & IBRD totalIDA blendIDA onlyIDA totalIndiaIndonesiaIran, Islamic Rep.IraqIrelandIsraelItalyJamaicaJapanJordanKazakhstanKenyaKiribatiKorea, Rep.KosovoKuwaitKyrgyz RepublicLao PDRLate-demographic dividendLatin America & Caribbean Latin America & Caribbean (excluding high income)Latin America & the Caribbean (IDA & IBRD countries)LatviaLeast developed countries: UN classificationLebanonLesothoLiberiaLibyaLithuaniaLow & middle incomeLow incomeLower middle incomeLuxembourgMacao SAR, ChinaMacedonia, FYRMadagascarMalawiMalaysiaMaldivesMaliMaltaMauritaniaMauritiusMexicoMicronesia, Fed. Sts.Middle East & North AfricaMiddle East & North Africa (excluding high income)Middle East & North Africa (IDA & IBRD countries)Middle incomeMoldovaMongoliaMontenegroMoroccoMozambiqueNamibiaNepalNetherlandsNew CaledoniaNew ZealandNicaraguaNigerNigeriaNorth AmericaNorwayOECD membersOmanOther small statesPacific island small statesPakistanPanamaPapua New GuineaParaguayPeruPhilippinesPolandPortugalPost-demographic dividendPre-demographic dividendPuerto RicoQatarRomaniaRussian FederationRwandaSaudi ArabiaSenegalSerbiaSeychellesSierra LeoneSingaporeSlovak RepublicSloveniaSmall statesSolomon IslandsSomaliaSouth AfricaSouth AsiaSouth Asia (IDA & IBRD)South SudanSpainSri LankaSt. Kitts and NevisSt. LuciaSt. Vincent and the GrenadinesSub-Saharan Africa Sub-Saharan Africa (excluding high income)Sub-Saharan Africa (IDA & IBRD countries)SudanSurinameSwazilandSwedenSwitzerlandSyrian Arab RepublicTajikistanTanzaniaThailandTimor-LesteTogoTongaTrinidad and TobagoTunisiaTurkeyTurkmenistanUgandaUkraineUnited Arab EmiratesUnited KingdomUnited StatesUpper middle incomeUruguayUzbekistanVanuatuVenezuela, RBVietnamWest Bank and GazaWorldYemen, Rep.ZambiaZimbabwe Timeline:
This timeline shows a graph from 1961 to 2016 of Brazil. No data until 1960. Number of actual observations by date: 56.
Source name:
World Development Indicators
Source organization:
World Bank national accounts data, and OECD National Accounts data files.
Categories, topics:
Economy & Growth
Last updated:
apr 23, 2017
Indicators value changes by year
Maximum:
20.195
jan 1, 2016
At the date of observation
Value
Absolute change
Change from previous value
jan 1, 1961
14.104
+14.104
0.0%
jan 1, 1962
14.645
+0.541
3.83%
jan 1, 1963
11.675
-2.97
-20.28%
jan 1, 1964
12.884
+1.209
10.36%
jan 1, 1965
11.713
-1.171
-9.09%
jan 1, 1966
10.873
-0.841
-7.18%
jan 1, 1967
11.15
+0.278
2.55%
jan 1, 1968
11.538
+0.388
3.48%
jan 1, 1969
11.133
-0.405
-3.51%
jan 1, 1970
10.815
-0.318
-2.86%
jan 1, 1971
11.325
+0.51
4.72%
jan 1, 1972
11.023
-0.302
-2.67%
jan 1, 1973
10.753
-0.27
-2.45%
jan 1, 1974
10.445
-0.308
-2.86%
jan 1, 1975
9.743
-0.702
-6.72%
jan 1, 1976
10.638
+0.894
9.18%
jan 1, 1977
10.521
-0.117
-1.1%
jan 1, 1978
9.436
-1.085
-10.32%
jan 1, 1979
9.655
+0.22
2.33%
jan 1, 1980
9.741
+0.085
0.88%
jan 1, 1981
9.198
-0.543
-5.57%
jan 1, 1982
9.318
+0.12
1.31%
jan 1, 1983
10.006
+0.687
7.38%
jan 1, 1984
9.661
-0.345
-3.45%
jan 1, 1985
8.285
-1.376
-14.24%
jan 1, 1986
9.869
+1.585
19.13%
jan 1, 1987
10.674
+0.805
8.15%
jan 1, 1988
12.164
+1.489
13.95%
jan 1, 1989
12.592
+0.428
3.52%
jan 1, 1990
15.499
+2.907
23.09%
jan 1, 1991
19.292
+3.793
24.47%
jan 1, 1992
17.9
-1.392
-7.22%
jan 1, 1993
17.063
-0.837
-4.67%
jan 1, 1994
17.664
+0.601
3.52%
jan 1, 1995
15.832
-1.832
-10.37%
jan 1, 1996
18.641
+2.809
17.74%
jan 1, 1997
19.751
+1.11
5.95%
jan 1, 1998
19.535
-0.215
-1.09%
jan 1, 1999
20.071
+0.535
2.74%
jan 1, 2000
19.783
-0.288
-1.43%
jan 1, 2001
18.768
-1.015
-5.13%
jan 1, 2002
19.343
+0.575
3.07%
jan 1, 2003
19.81
+0.466
2.41%
jan 1, 2004
19.077
-0.732
-3.7%
jan 1, 2005
18.468
-0.61
-3.2%
jan 1, 2006
18.89
+0.422
2.29%
jan 1, 2007
19.039
+0.149
0.79%
jan 1, 2008
18.943
-0.096
-0.5%
jan 1, 2009
18.839
-0.104
-0.55%
jan 1, 2010
19.651
+0.811
4.31%
jan 1, 2011
19.017
-0.634
-3.23%
jan 1, 2012
18.688
-0.328
-1.73%
jan 1, 2013
18.574
-0.115
-0.61%
jan 1, 2014
18.956
+0.382
2.06%
jan 1, 2015
19.495
+0.539
2.84%
jan 1, 2016
20.195
+0.701
3.59%
Ranking of countries by current statistics by years


Comments: