29
/
en
AIzaSyAYiBZKx7MnpbEhh9jyipgxe19OcubqV5w
April 1, 2024
191412
Malta
MLT
true
2
1
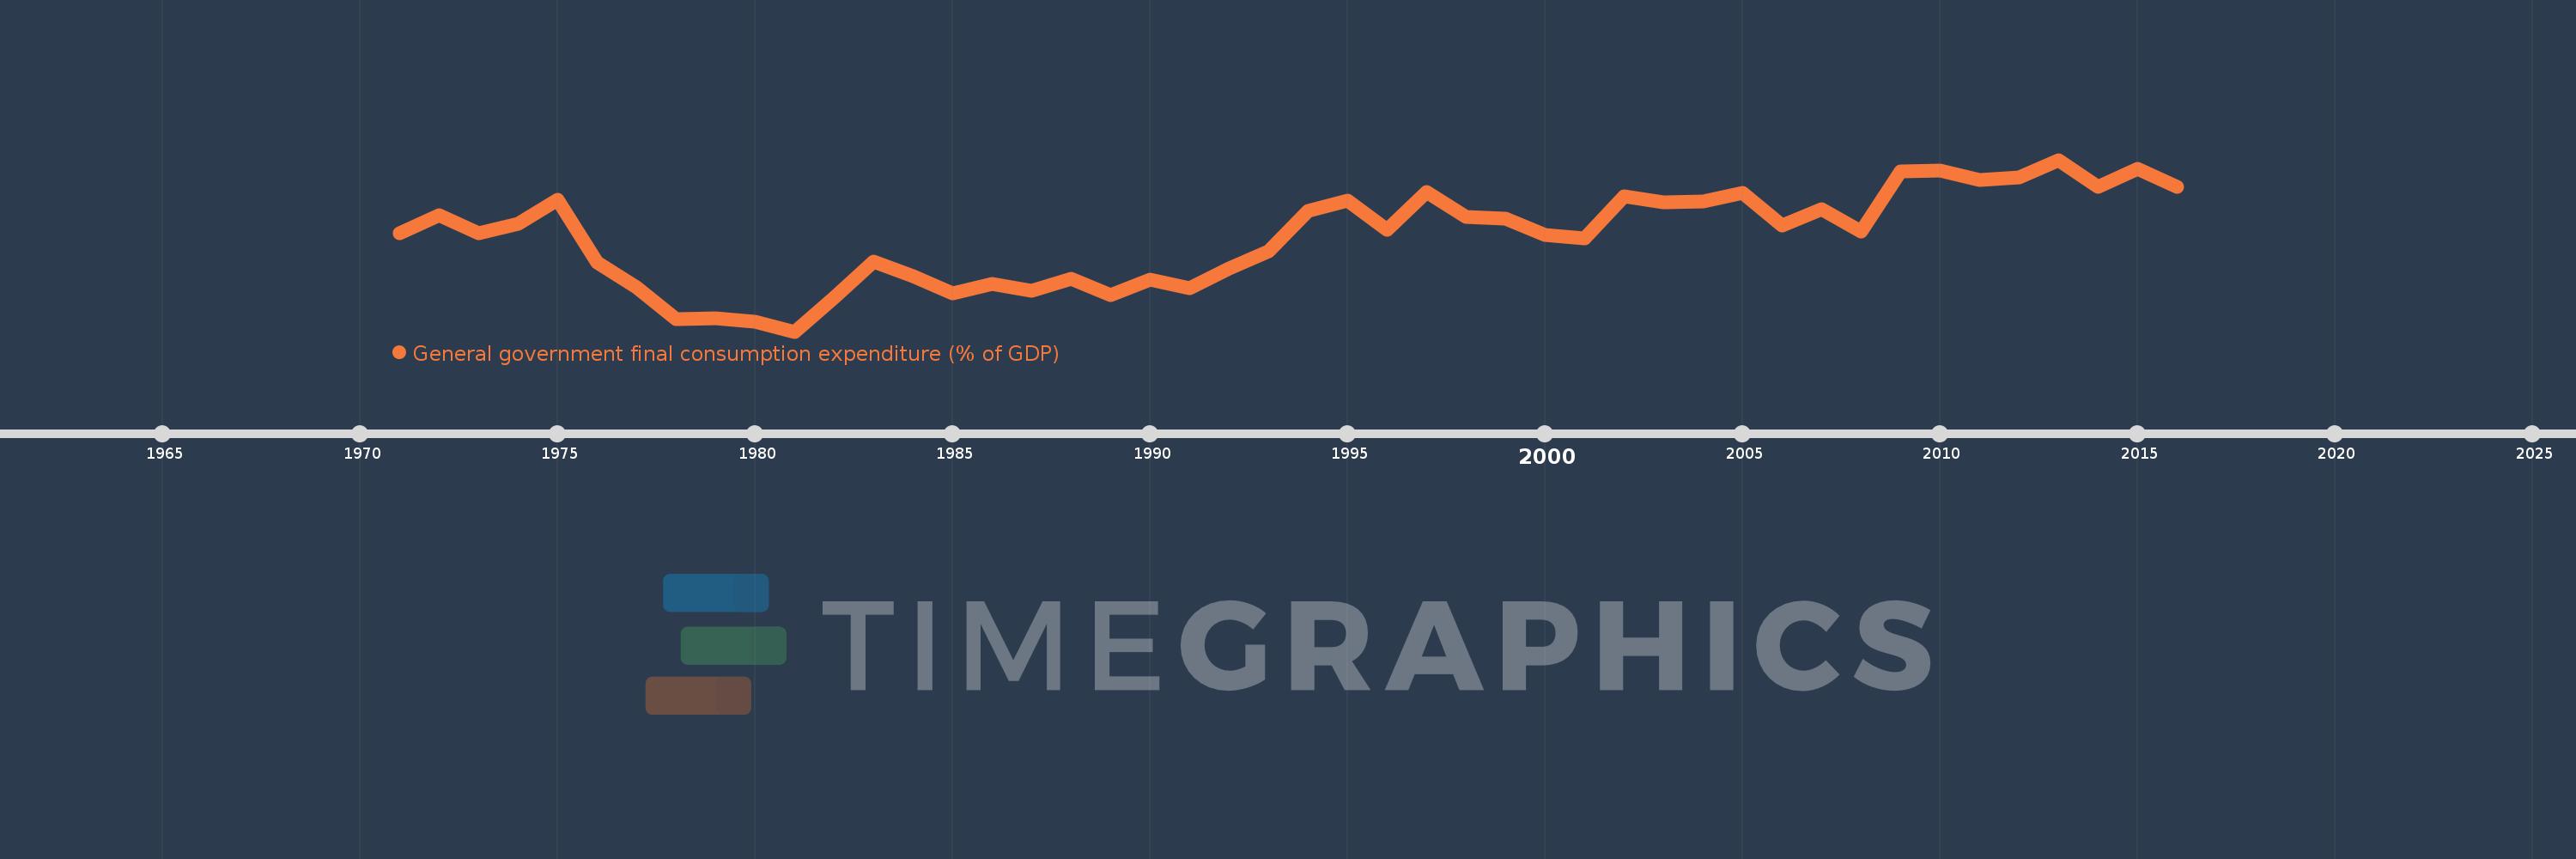
General government final consumption expenditure (% of GDP)
2016,2015,2014,2013,2012,2011,2010,2009,2008,2007,2006,2005,2004,2003,2002,2001,2000,1999,1998,1997,1996,1995,1994,1993,1992,1991,1990,1989,1988,1987,1986,1985,1984,1983,1982,1981,1980,1979,1978,1977,1976,1975,1974,1973,1972,1971
This statistics in other country:
AfghanistanAlbaniaAlgeriaAngolaAntigua and BarbudaArab WorldArgentinaArmeniaArubaAustraliaAustriaAzerbaijanBahamas, TheBahrainBangladeshBarbadosBelarusBelgiumBelizeBeninBermudaBhutanBoliviaBosnia and HerzegovinaBotswanaBrazilBrunei DarussalamBulgariaBurkina FasoBurundiCabo VerdeCambodiaCameroonCanadaCaribbean small statesCentral African RepublicCentral Europe and the BalticsChadChileChinaColombiaComorosCongo, Dem. Rep.Congo, Rep.Costa RicaCote d'IvoireCroatiaCubaCyprusCzech RepublicDenmarkDjiboutiDominicaDominican RepublicEarly-demographic dividendEast Asia & PacificEast Asia & Pacific (excluding high income)East Asia & Pacific (IDA & IBRD countries)EcuadorEgypt, Arab Rep.El SalvadorEquatorial GuineaEritreaEstoniaEthiopiaEuro areaEurope & Central AsiaEurope & Central Asia (excluding high income)Europe & Central Asia (IDA & IBRD countries)European UnionFaroe IslandsFijiFinlandFragile and conflict affected situationsFranceFrench PolynesiaGabonGambia, TheGeorgiaGermanyGhanaGreeceGrenadaGuatemalaGuineaGuinea-BissauGuyanaHaitiHeavily indebted poor countries (HIPC)High incomeHondurasHong Kong SAR, ChinaHungaryIBRD onlyIcelandIDA & IBRD totalIDA blendIDA onlyIDA totalIndiaIndonesiaIran, Islamic Rep.IraqIrelandIsraelItalyJamaicaJapanJordanKazakhstanKenyaKiribatiKorea, Rep.KosovoKuwaitKyrgyz RepublicLao PDRLate-demographic dividendLatin America & Caribbean Latin America & Caribbean (excluding high income)Latin America & the Caribbean (IDA & IBRD countries)LatviaLeast developed countries: UN classificationLebanonLesothoLiberiaLibyaLithuaniaLow & middle incomeLow incomeLower middle incomeLuxembourgMacao SAR, ChinaMacedonia, FYRMadagascarMalawiMalaysiaMaldivesMaliMaltaMauritaniaMauritiusMexicoMicronesia, Fed. Sts.Middle East & North AfricaMiddle East & North Africa (excluding high income)Middle East & North Africa (IDA & IBRD countries)Middle incomeMoldovaMongoliaMontenegroMoroccoMozambiqueNamibiaNepalNetherlandsNew CaledoniaNew ZealandNicaraguaNigerNigeriaNorth AmericaNorwayOECD membersOmanOther small statesPacific island small statesPakistanPanamaPapua New GuineaParaguayPeruPhilippinesPolandPortugalPost-demographic dividendPre-demographic dividendPuerto RicoQatarRomaniaRussian FederationRwandaSaudi ArabiaSenegalSerbiaSeychellesSierra LeoneSingaporeSlovak RepublicSloveniaSmall statesSolomon IslandsSomaliaSouth AfricaSouth AsiaSouth Asia (IDA & IBRD)South SudanSpainSri LankaSt. Kitts and NevisSt. LuciaSt. Vincent and the GrenadinesSub-Saharan Africa Sub-Saharan Africa (excluding high income)Sub-Saharan Africa (IDA & IBRD countries)SudanSurinameSwazilandSwedenSwitzerlandSyrian Arab RepublicTajikistanTanzaniaThailandTimor-LesteTogoTongaTrinidad and TobagoTunisiaTurkeyTurkmenistanUgandaUkraineUnited Arab EmiratesUnited KingdomUnited StatesUpper middle incomeUruguayUzbekistanVanuatuVenezuela, RBVietnamWest Bank and GazaWorldYemen, Rep.ZambiaZimbabwe Timeline:
This timeline shows a graph from 1971 to 2016 of Malta. No data until 1970. Number of actual observations by date: 46.
Source name:
World Development Indicators
Source organization:
World Bank national accounts data, and OECD National Accounts data files.
Categories, topics:
Economy & Growth
Last updated:
apr 23, 2017
Indicators value changes by year
Minimum:
14.926
jan 1, 1981
Maximum:
20.089
jan 1, 2013
At the date of observation
Value
Absolute change
Change from previous value
jan 1, 1971
17.869
+17.869
0.0%
jan 1, 1972
18.412
+0.544
3.04%
jan 1, 1973
17.875
-0.537
-2.92%
jan 1, 1974
18.172
+0.297
1.66%
jan 1, 1975
18.88
+0.708
3.9%
jan 1, 1976
17.003
-1.877
-9.94%
jan 1, 1977
16.265
-0.737
-4.34%
jan 1, 1978
15.301
-0.965
-5.93%
jan 1, 1979
15.33
+0.029
0.19%
jan 1, 1980
15.214
-0.116
-0.76%
jan 1, 1981
14.926
-0.287
-1.89%
jan 1, 1982
15.953
+1.026
6.88%
jan 1, 1983
17.039
+1.086
6.81%
jan 1, 1984
16.599
-0.44
-2.58%
jan 1, 1985
16.086
-0.514
-3.09%
jan 1, 1986
16.355
+0.269
1.67%
jan 1, 1987
16.146
-0.209
-1.28%
jan 1, 1988
16.519
+0.373
2.31%
jan 1, 1989
16.015
-0.504
-3.05%
jan 1, 1990
16.481
+0.466
2.91%
jan 1, 1991
16.23
-0.25
-1.52%
jan 1, 1992
16.828
+0.598
3.68%
jan 1, 1993
17.346
+0.518
3.08%
jan 1, 1994
18.551
+1.204
6.94%
jan 1, 1995
18.852
+0.301
1.63%
jan 1, 1996
17.982
-0.871
-4.62%
jan 1, 1997
19.129
+1.147
6.38%
jan 1, 1998
18.364
-0.765
-4.0%
jan 1, 1999
18.321
-0.043
-0.23%
jan 1, 2000
17.835
-0.486
-2.65%
jan 1, 2001
17.73
-0.106
-0.59%
jan 1, 2002
18.989
+1.259
7.1%
jan 1, 2003
18.817
-0.172
-0.9%
jan 1, 2004
18.833
+0.016
0.09%
jan 1, 2005
19.103
+0.27
1.43%
jan 1, 2006
18.107
-0.996
-5.21%
jan 1, 2007
18.616
+0.509
2.81%
jan 1, 2008
17.937
-0.68
-3.65%
jan 1, 2009
19.733
+1.797
10.02%
jan 1, 2010
19.775
+0.041
0.21%
jan 1, 2011
19.492
-0.282
-1.43%
jan 1, 2012
19.552
+0.06
0.31%
jan 1, 2013
20.089
+0.537
2.75%
jan 1, 2014
19.281
-0.808
-4.02%
jan 1, 2015
19.812
+0.531
2.76%
jan 1, 2016
19.273
-0.539
-2.72%
Ranking of countries by current statistics by years


Comments: