29
/
en
AIzaSyAYiBZKx7MnpbEhh9jyipgxe19OcubqV5w
April 1, 2024
154609
India
IND
true
2
1
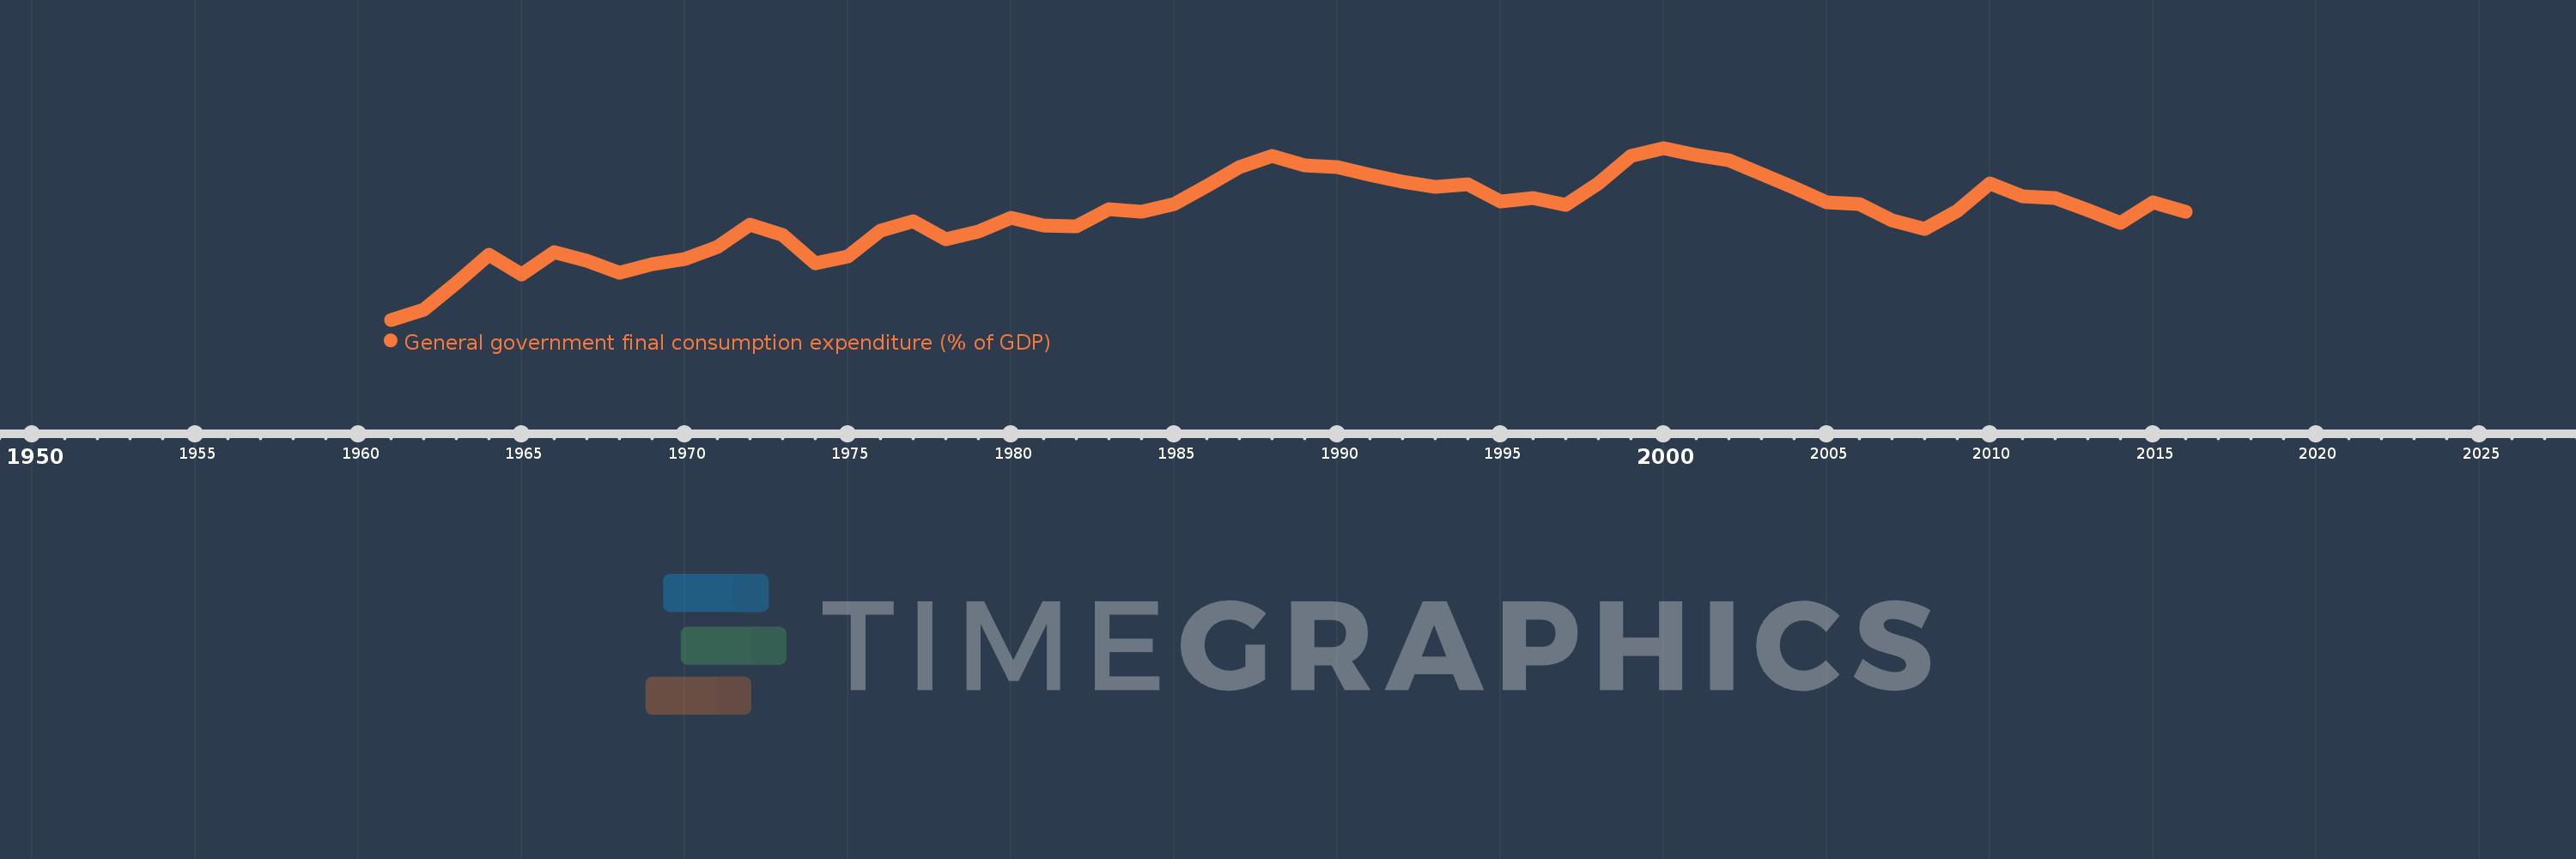
General government final consumption expenditure (% of GDP)
2016,2015,2014,2013,2012,2011,2010,2009,2008,2007,2006,2005,2004,2003,2002,2001,2000,1999,1998,1997,1996,1995,1994,1993,1992,1991,1990,1989,1988,1987,1986,1985,1984,1983,1982,1981,1980,1979,1978,1977,1976,1975,1974,1973,1972,1971,1970,1969,1968,1967,1966,1965,1964,1963,1962,1961
This statistics in other country:
AfghanistanAlbaniaAlgeriaAngolaAntigua and BarbudaArab WorldArgentinaArmeniaArubaAustraliaAustriaAzerbaijanBahamas, TheBahrainBangladeshBarbadosBelarusBelgiumBelizeBeninBermudaBhutanBoliviaBosnia and HerzegovinaBotswanaBrazilBrunei DarussalamBulgariaBurkina FasoBurundiCabo VerdeCambodiaCameroonCanadaCaribbean small statesCentral African RepublicCentral Europe and the BalticsChadChileChinaColombiaComorosCongo, Dem. Rep.Congo, Rep.Costa RicaCote d'IvoireCroatiaCubaCyprusCzech RepublicDenmarkDjiboutiDominicaDominican RepublicEarly-demographic dividendEast Asia & PacificEast Asia & Pacific (excluding high income)East Asia & Pacific (IDA & IBRD countries)EcuadorEgypt, Arab Rep.El SalvadorEquatorial GuineaEritreaEstoniaEthiopiaEuro areaEurope & Central AsiaEurope & Central Asia (excluding high income)Europe & Central Asia (IDA & IBRD countries)European UnionFaroe IslandsFijiFinlandFragile and conflict affected situationsFranceFrench PolynesiaGabonGambia, TheGeorgiaGermanyGhanaGreeceGrenadaGuatemalaGuineaGuinea-BissauGuyanaHaitiHeavily indebted poor countries (HIPC)High incomeHondurasHong Kong SAR, ChinaHungaryIBRD onlyIcelandIDA & IBRD totalIDA blendIDA onlyIDA totalIndiaIndonesiaIran, Islamic Rep.IraqIrelandIsraelItalyJamaicaJapanJordanKazakhstanKenyaKiribatiKorea, Rep.KosovoKuwaitKyrgyz RepublicLao PDRLate-demographic dividendLatin America & Caribbean Latin America & Caribbean (excluding high income)Latin America & the Caribbean (IDA & IBRD countries)LatviaLeast developed countries: UN classificationLebanonLesothoLiberiaLibyaLithuaniaLow & middle incomeLow incomeLower middle incomeLuxembourgMacao SAR, ChinaMacedonia, FYRMadagascarMalawiMalaysiaMaldivesMaliMaltaMauritaniaMauritiusMexicoMicronesia, Fed. Sts.Middle East & North AfricaMiddle East & North Africa (excluding high income)Middle East & North Africa (IDA & IBRD countries)Middle incomeMoldovaMongoliaMontenegroMoroccoMozambiqueNamibiaNepalNetherlandsNew CaledoniaNew ZealandNicaraguaNigerNigeriaNorth AmericaNorwayOECD membersOmanOther small statesPacific island small statesPakistanPanamaPapua New GuineaParaguayPeruPhilippinesPolandPortugalPost-demographic dividendPre-demographic dividendPuerto RicoQatarRomaniaRussian FederationRwandaSaudi ArabiaSenegalSerbiaSeychellesSierra LeoneSingaporeSlovak RepublicSloveniaSmall statesSolomon IslandsSomaliaSouth AfricaSouth AsiaSouth Asia (IDA & IBRD)South SudanSpainSri LankaSt. Kitts and NevisSt. LuciaSt. Vincent and the GrenadinesSub-Saharan Africa Sub-Saharan Africa (excluding high income)Sub-Saharan Africa (IDA & IBRD countries)SudanSurinameSwazilandSwedenSwitzerlandSyrian Arab RepublicTajikistanTanzaniaThailandTimor-LesteTogoTongaTrinidad and TobagoTunisiaTurkeyTurkmenistanUgandaUkraineUnited Arab EmiratesUnited KingdomUnited StatesUpper middle incomeUruguayUzbekistanVanuatuVenezuela, RBVietnamWest Bank and GazaWorldYemen, Rep.ZambiaZimbabwe Timeline:
This timeline shows a graph from 1961 to 2016 of India. No data until 1960. Number of actual observations by date: 56.
Source name:
World Development Indicators
Source organization:
World Bank national accounts data, and OECD National Accounts data files.
Categories, topics:
Economy & Growth
Last updated:
apr 23, 2017
Indicators value changes by year
Maximum:
12.795
jan 1, 2000
At the date of observation
Value
Absolute change
Change from previous value
jan 1, 1961
6.911
+6.911
0.0%
jan 1, 1962
7.244
+0.333
4.81%
jan 1, 1963
8.175
+0.931
12.85%
jan 1, 1964
9.147
+0.972
11.89%
jan 1, 1965
8.452
-0.695
-7.6%
jan 1, 1966
9.235
+0.783
9.27%
jan 1, 1967
8.941
-0.294
-3.18%
jan 1, 1968
8.534
-0.408
-4.56%
jan 1, 1969
8.827
+0.293
3.44%
jan 1, 1970
8.986
+0.159
1.8%
jan 1, 1971
9.402
+0.417
4.64%
jan 1, 1972
10.167
+0.765
8.13%
jan 1, 1973
9.809
-0.358
-3.52%
jan 1, 1974
8.835
-0.974
-9.93%
jan 1, 1975
9.08
+0.245
2.77%
jan 1, 1976
9.97
+0.89
9.8%
jan 1, 1977
10.278
+0.308
3.09%
jan 1, 1978
9.679
-0.599
-5.83%
jan 1, 1979
9.92
+0.241
2.49%
jan 1, 1980
10.399
+0.479
4.82%
jan 1, 1981
10.144
-0.255
-2.45%
jan 1, 1982
10.116
-0.027
-0.27%
jan 1, 1983
10.69
+0.574
5.68%
jan 1, 1984
10.605
-0.085
-0.8%
jan 1, 1985
10.883
+0.278
2.62%
jan 1, 1986
11.487
+0.604
5.55%
jan 1, 1987
12.138
+0.652
5.67%
jan 1, 1988
12.536
+0.398
3.28%
jan 1, 1989
12.195
-0.341
-2.72%
jan 1, 1990
12.153
-0.043
-0.35%
jan 1, 1991
11.86
-0.292
-2.41%
jan 1, 1992
11.643
-0.217
-1.83%
jan 1, 1993
11.471
-0.172
-1.48%
jan 1, 1994
11.563
+0.092
0.8%
jan 1, 1995
10.967
-0.596
-5.15%
jan 1, 1996
11.077
+0.11
1.0%
jan 1, 1997
10.857
-0.22
-1.99%
jan 1, 1998
11.59
+0.733
6.76%
jan 1, 1999
12.516
+0.926
7.99%
jan 1, 2000
12.795
+0.279
2.23%
jan 1, 2001
12.556
-0.239
-1.87%
jan 1, 2002
12.36
-0.196
-1.56%
jan 1, 2003
11.89
-0.47
-3.8%
jan 1, 2004
11.43
-0.46
-3.87%
jan 1, 2005
10.934
-0.496
-4.34%
jan 1, 2006
10.874
-0.06
-0.55%
jan 1, 2007
10.326
-0.548
-5.04%
jan 1, 2008
10.014
-0.312
-3.02%
jan 1, 2009
10.64
+0.625
6.25%
jan 1, 2010
11.589
+0.949
8.92%
jan 1, 2011
11.132
-0.457
-3.94%
jan 1, 2012
11.085
-0.047
-0.43%
jan 1, 2013
10.665
-0.419
-3.78%
jan 1, 2014
10.228
-0.437
-4.1%
jan 1, 2015
10.934
+0.706
6.9%
jan 1, 2016
10.601
-0.333
-3.05%
Ranking of countries by current statistics by years


Comments: