29
/
en
AIzaSyAYiBZKx7MnpbEhh9jyipgxe19OcubqV5w
April 1, 2024
76177
Bahamas, The
BHS
true
2
1
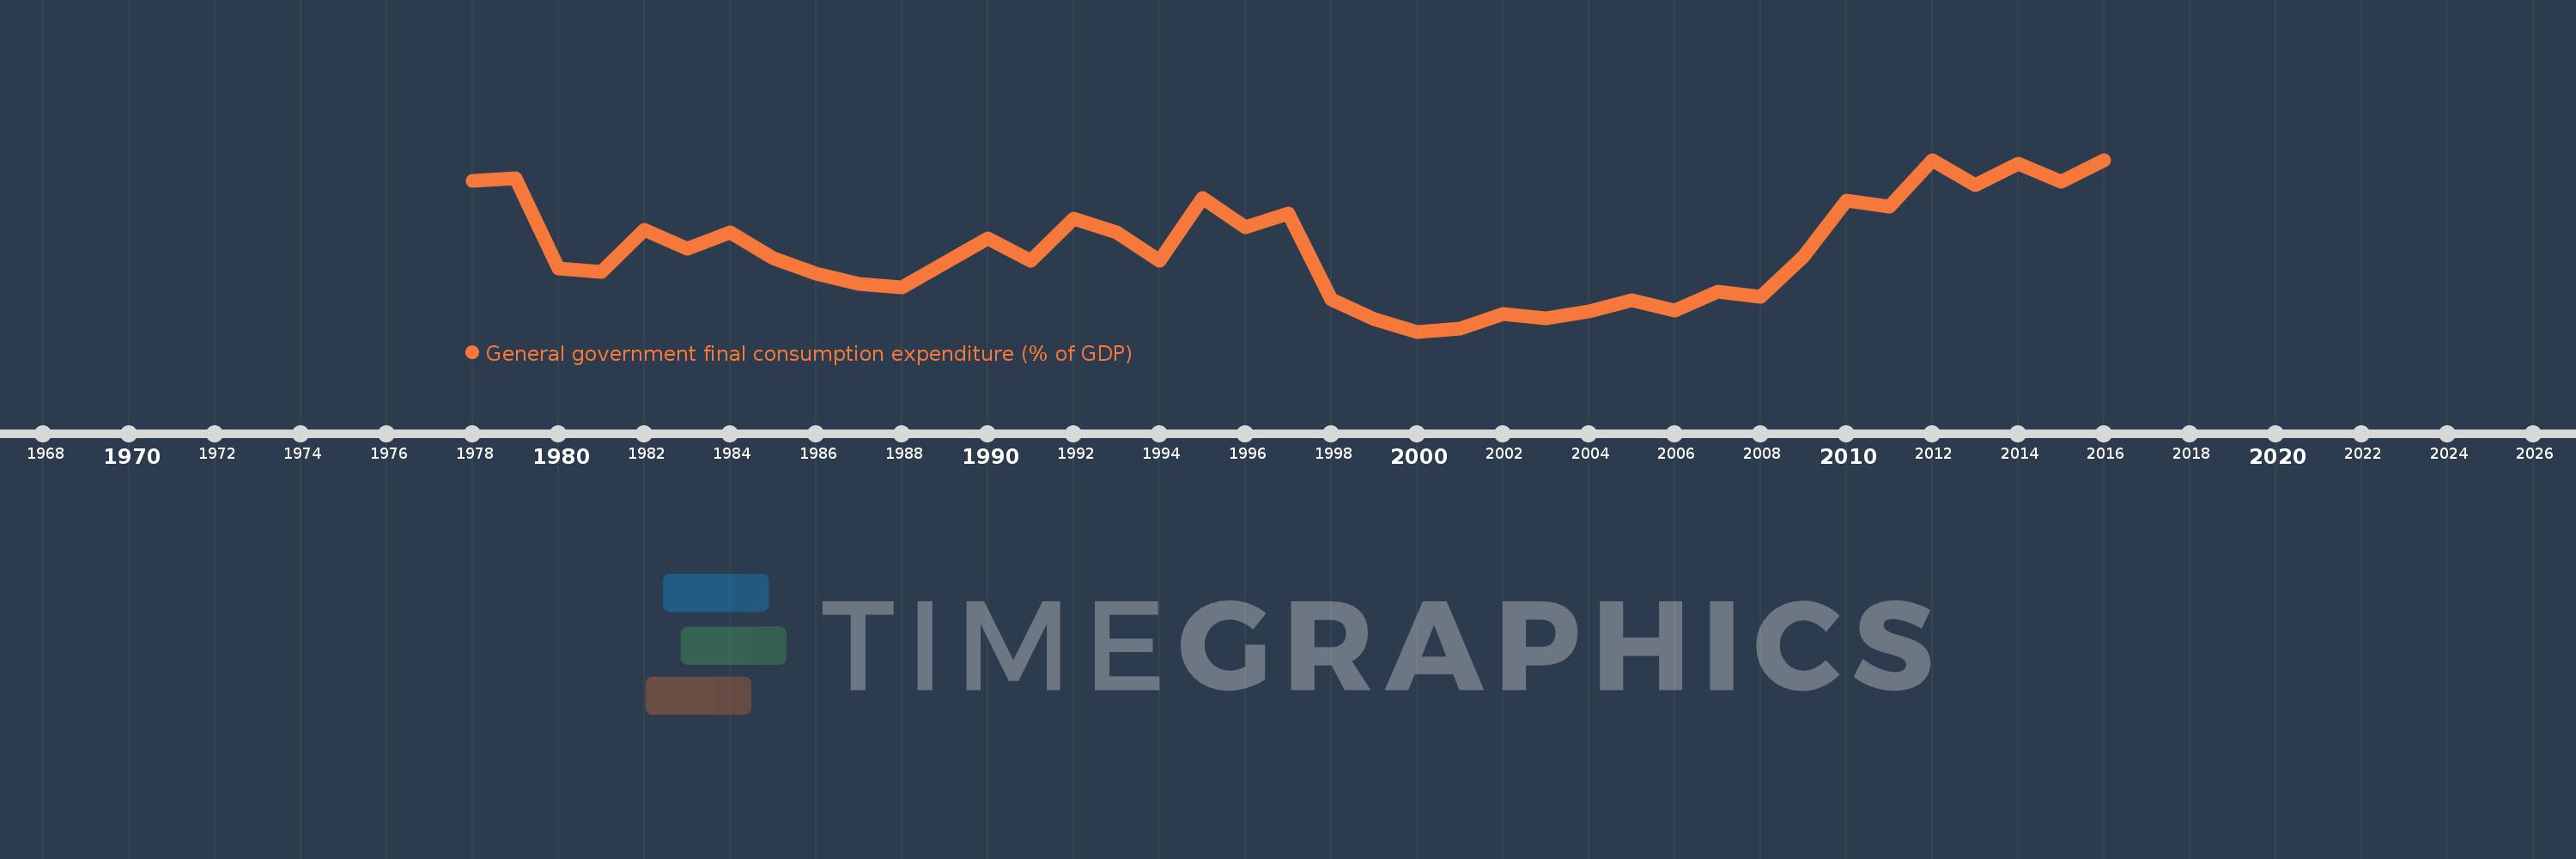
General government final consumption expenditure (% of GDP)
2016,2015,2014,2013,2012,2011,2010,2009,2008,2007,2006,2005,2004,2003,2002,2001,2000,1999,1998,1997,1996,1995,1994,1993,1992,1991,1990,1988,1987,1986,1985,1984,1983,1982,1981,1980,1979,1978
This statistics in other country:
AfghanistanAlbaniaAlgeriaAngolaAntigua and BarbudaArab WorldArgentinaArmeniaArubaAustraliaAustriaAzerbaijanBahamas, TheBahrainBangladeshBarbadosBelarusBelgiumBelizeBeninBermudaBhutanBoliviaBosnia and HerzegovinaBotswanaBrazilBrunei DarussalamBulgariaBurkina FasoBurundiCabo VerdeCambodiaCameroonCanadaCaribbean small statesCentral African RepublicCentral Europe and the BalticsChadChileChinaColombiaComorosCongo, Dem. Rep.Congo, Rep.Costa RicaCote d'IvoireCroatiaCubaCyprusCzech RepublicDenmarkDjiboutiDominicaDominican RepublicEarly-demographic dividendEast Asia & PacificEast Asia & Pacific (excluding high income)East Asia & Pacific (IDA & IBRD countries)EcuadorEgypt, Arab Rep.El SalvadorEquatorial GuineaEritreaEstoniaEthiopiaEuro areaEurope & Central AsiaEurope & Central Asia (excluding high income)Europe & Central Asia (IDA & IBRD countries)European UnionFaroe IslandsFijiFinlandFragile and conflict affected situationsFranceFrench PolynesiaGabonGambia, TheGeorgiaGermanyGhanaGreeceGrenadaGuatemalaGuineaGuinea-BissauGuyanaHaitiHeavily indebted poor countries (HIPC)High incomeHondurasHong Kong SAR, ChinaHungaryIBRD onlyIcelandIDA & IBRD totalIDA blendIDA onlyIDA totalIndiaIndonesiaIran, Islamic Rep.IraqIrelandIsraelItalyJamaicaJapanJordanKazakhstanKenyaKiribatiKorea, Rep.KosovoKuwaitKyrgyz RepublicLao PDRLate-demographic dividendLatin America & Caribbean Latin America & Caribbean (excluding high income)Latin America & the Caribbean (IDA & IBRD countries)LatviaLeast developed countries: UN classificationLebanonLesothoLiberiaLibyaLithuaniaLow & middle incomeLow incomeLower middle incomeLuxembourgMacao SAR, ChinaMacedonia, FYRMadagascarMalawiMalaysiaMaldivesMaliMaltaMauritaniaMauritiusMexicoMicronesia, Fed. Sts.Middle East & North AfricaMiddle East & North Africa (excluding high income)Middle East & North Africa (IDA & IBRD countries)Middle incomeMoldovaMongoliaMontenegroMoroccoMozambiqueNamibiaNepalNetherlandsNew CaledoniaNew ZealandNicaraguaNigerNigeriaNorth AmericaNorwayOECD membersOmanOther small statesPacific island small statesPakistanPanamaPapua New GuineaParaguayPeruPhilippinesPolandPortugalPost-demographic dividendPre-demographic dividendPuerto RicoQatarRomaniaRussian FederationRwandaSaudi ArabiaSenegalSerbiaSeychellesSierra LeoneSingaporeSlovak RepublicSloveniaSmall statesSolomon IslandsSomaliaSouth AfricaSouth AsiaSouth Asia (IDA & IBRD)South SudanSpainSri LankaSt. Kitts and NevisSt. LuciaSt. Vincent and the GrenadinesSub-Saharan Africa Sub-Saharan Africa (excluding high income)Sub-Saharan Africa (IDA & IBRD countries)SudanSurinameSwazilandSwedenSwitzerlandSyrian Arab RepublicTajikistanTanzaniaThailandTimor-LesteTogoTongaTrinidad and TobagoTunisiaTurkeyTurkmenistanUgandaUkraineUnited Arab EmiratesUnited KingdomUnited StatesUpper middle incomeUruguayUzbekistanVanuatuVenezuela, RBVietnamWest Bank and GazaWorldYemen, Rep.ZambiaZimbabwe Timeline:
This timeline shows a graph from 1978 to 2016 of Bahamas, The. No data until 1977. Number of actual observations by date: 38.
Source name:
World Development Indicators
Source organization:
World Bank national accounts data, and OECD National Accounts data files.
Categories, topics:
Economy & Growth
Last updated:
apr 23, 2017
Indicators value changes by year
Minimum:
10.669
jan 1, 2000
Maximum:
15.987
jan 1, 2012
At the date of observation
Value
Absolute change
Change from previous value
jan 1, 1978
15.33
+15.33
0.0%
jan 1, 1979
15.425
+0.096
0.62%
jan 1, 1980
12.616
-2.809
-18.21%
jan 1, 1981
12.507
-0.11
-0.87%
jan 1, 1982
13.831
+1.325
10.59%
jan 1, 1983
13.236
-0.595
-4.3%
jan 1, 1984
13.735
+0.499
3.77%
jan 1, 1985
12.934
-0.801
-5.83%
jan 1, 1986
12.457
-0.477
-3.69%
jan 1, 1987
12.138
-0.32
-2.57%
jan 1, 1988
12.027
-0.111
-0.91%
jan 1, 1990
13.562
+1.536
12.77%
jan 1, 1991
12.859
-0.703
-5.18%
jan 1, 1992
14.161
+1.302
10.13%
jan 1, 1993
13.743
-0.418
-2.95%
jan 1, 1994
12.872
-0.871
-6.34%
jan 1, 1995
14.811
+1.939
15.06%
jan 1, 1996
13.887
-0.923
-6.23%
jan 1, 1997
14.322
+0.434
3.13%
jan 1, 1998
11.66
-2.661
-18.58%
jan 1, 1999
11.066
-0.595
-5.1%
jan 1, 2000
10.669
-0.397
-3.59%
jan 1, 2001
10.753
+0.084
0.79%
jan 1, 2002
11.208
+0.456
4.24%
jan 1, 2003
11.072
-0.136
-1.22%
jan 1, 2004
11.296
+0.224
2.02%
jan 1, 2005
11.647
+0.351
3.11%
jan 1, 2006
11.331
-0.316
-2.71%
jan 1, 2007
11.896
+0.565
4.99%
jan 1, 2008
11.733
-0.164
-1.38%
jan 1, 2009
12.996
+1.263
10.77%
jan 1, 2010
14.724
+1.728
13.3%
jan 1, 2011
14.544
-0.18
-1.23%
jan 1, 2012
15.987
+1.443
9.92%
jan 1, 2013
15.207
-0.78
-4.88%
jan 1, 2014
15.88
+0.673
4.42%
jan 1, 2015
15.318
-0.562
-3.54%
jan 1, 2016
15.974
+0.656
4.28%
Ranking of countries by current statistics by years


Comments: