29
/
en
AIzaSyAYiBZKx7MnpbEhh9jyipgxe19OcubqV5w
April 1, 2024
256345
Sweden
SWE
true
2
1
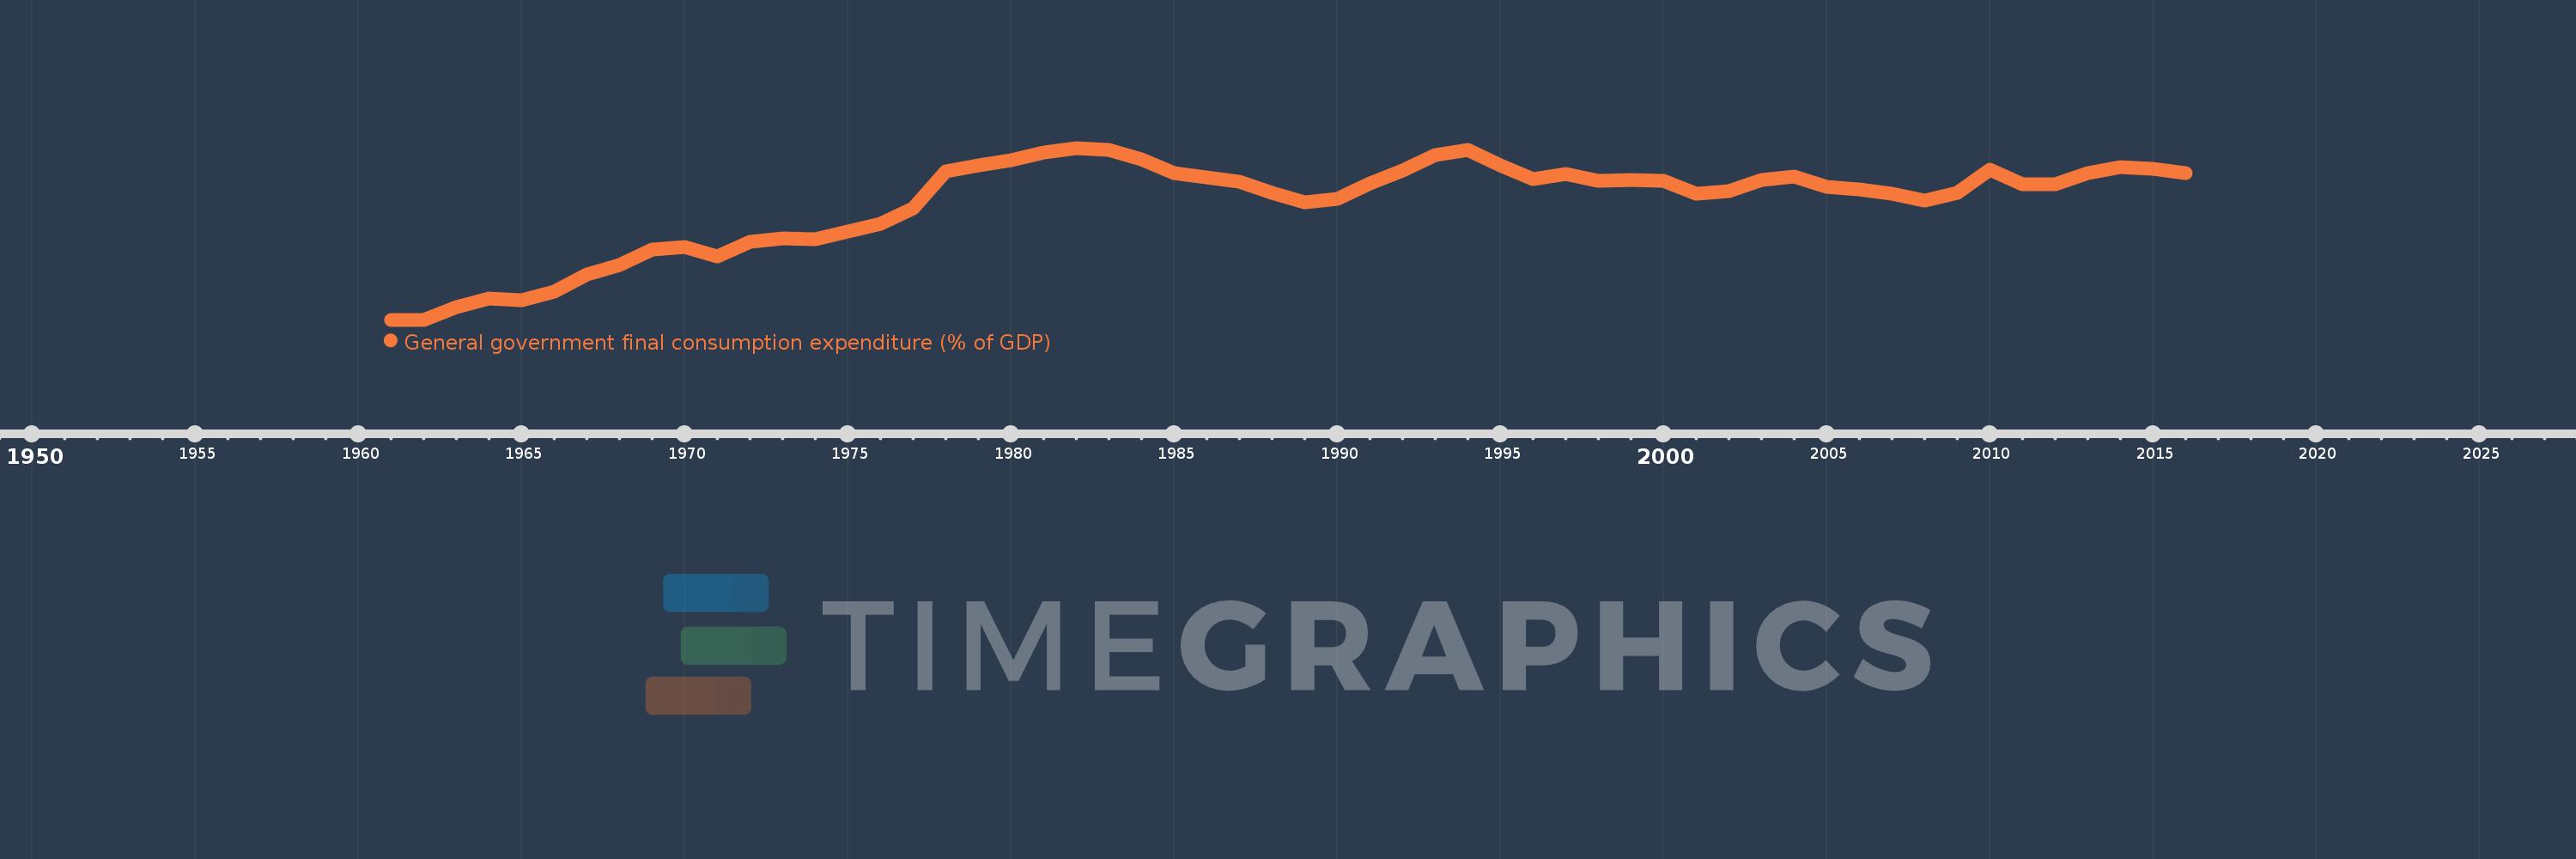
General government final consumption expenditure (% of GDP)
2016,2015,2014,2013,2012,2011,2010,2009,2008,2007,2006,2005,2004,2003,2002,2001,2000,1999,1998,1997,1996,1995,1994,1993,1992,1991,1990,1989,1988,1987,1986,1985,1984,1983,1982,1981,1980,1979,1978,1977,1976,1975,1974,1973,1972,1971,1970,1969,1968,1967,1966,1965,1964,1963,1962,1961
This statistics in other country:
AfghanistanAlbaniaAlgeriaAngolaAntigua and BarbudaArab WorldArgentinaArmeniaArubaAustraliaAustriaAzerbaijanBahamas, TheBahrainBangladeshBarbadosBelarusBelgiumBelizeBeninBermudaBhutanBoliviaBosnia and HerzegovinaBotswanaBrazilBrunei DarussalamBulgariaBurkina FasoBurundiCabo VerdeCambodiaCameroonCanadaCaribbean small statesCentral African RepublicCentral Europe and the BalticsChadChileChinaColombiaComorosCongo, Dem. Rep.Congo, Rep.Costa RicaCote d'IvoireCroatiaCubaCyprusCzech RepublicDenmarkDjiboutiDominicaDominican RepublicEarly-demographic dividendEast Asia & PacificEast Asia & Pacific (excluding high income)East Asia & Pacific (IDA & IBRD countries)EcuadorEgypt, Arab Rep.El SalvadorEquatorial GuineaEritreaEstoniaEthiopiaEuro areaEurope & Central AsiaEurope & Central Asia (excluding high income)Europe & Central Asia (IDA & IBRD countries)European UnionFaroe IslandsFijiFinlandFragile and conflict affected situationsFranceFrench PolynesiaGabonGambia, TheGeorgiaGermanyGhanaGreeceGrenadaGuatemalaGuineaGuinea-BissauGuyanaHaitiHeavily indebted poor countries (HIPC)High incomeHondurasHong Kong SAR, ChinaHungaryIBRD onlyIcelandIDA & IBRD totalIDA blendIDA onlyIDA totalIndiaIndonesiaIran, Islamic Rep.IraqIrelandIsraelItalyJamaicaJapanJordanKazakhstanKenyaKiribatiKorea, Rep.KosovoKuwaitKyrgyz RepublicLao PDRLate-demographic dividendLatin America & Caribbean Latin America & Caribbean (excluding high income)Latin America & the Caribbean (IDA & IBRD countries)LatviaLeast developed countries: UN classificationLebanonLesothoLiberiaLibyaLithuaniaLow & middle incomeLow incomeLower middle incomeLuxembourgMacao SAR, ChinaMacedonia, FYRMadagascarMalawiMalaysiaMaldivesMaliMaltaMauritaniaMauritiusMexicoMicronesia, Fed. Sts.Middle East & North AfricaMiddle East & North Africa (excluding high income)Middle East & North Africa (IDA & IBRD countries)Middle incomeMoldovaMongoliaMontenegroMoroccoMozambiqueNamibiaNepalNetherlandsNew CaledoniaNew ZealandNicaraguaNigerNigeriaNorth AmericaNorwayOECD membersOmanOther small statesPacific island small statesPakistanPanamaPapua New GuineaParaguayPeruPhilippinesPolandPortugalPost-demographic dividendPre-demographic dividendPuerto RicoQatarRomaniaRussian FederationRwandaSaudi ArabiaSenegalSerbiaSeychellesSierra LeoneSingaporeSlovak RepublicSloveniaSmall statesSolomon IslandsSomaliaSouth AfricaSouth AsiaSouth Asia (IDA & IBRD)South SudanSpainSri LankaSt. Kitts and NevisSt. LuciaSt. Vincent and the GrenadinesSub-Saharan Africa Sub-Saharan Africa (excluding high income)Sub-Saharan Africa (IDA & IBRD countries)SudanSurinameSwazilandSwedenSwitzerlandSyrian Arab RepublicTajikistanTanzaniaThailandTimor-LesteTogoTongaTrinidad and TobagoTunisiaTurkeyTurkmenistanUgandaUkraineUnited Arab EmiratesUnited KingdomUnited StatesUpper middle incomeUruguayUzbekistanVanuatuVenezuela, RBVietnamWest Bank and GazaWorldYemen, Rep.ZambiaZimbabwe Timeline:
This timeline shows a graph from 1961 to 2016 of Sweden. No data until 1960. Number of actual observations by date: 56.
Source name:
World Development Indicators
Source organization:
World Bank national accounts data, and OECD National Accounts data files.
Categories, topics:
Economy & Growth
Last updated:
apr 23, 2017
Indicators value changes by year
Minimum:
16.057
jan 1, 1961
Maximum:
27.632
jan 1, 1982
At the date of observation
Value
Absolute change
Change from previous value
jan 1, 1961
16.057
+16.057
0.0%
jan 1, 1962
16.063
+0.007
0.04%
jan 1, 1963
16.935
+0.872
5.43%
jan 1, 1964
17.472
+0.537
3.17%
jan 1, 1965
17.374
-0.097
-0.56%
jan 1, 1966
17.938
+0.564
3.25%
jan 1, 1967
19.087
+1.149
6.4%
jan 1, 1968
19.724
+0.637
3.34%
jan 1, 1969
20.767
+1.044
5.29%
jan 1, 1970
20.976
+0.208
1.0%
jan 1, 1971
20.321
-0.654
-3.12%
jan 1, 1972
21.299
+0.977
4.81%
jan 1, 1973
21.523
+0.224
1.05%
jan 1, 1974
21.486
-0.037
-0.17%
jan 1, 1975
21.984
+0.499
2.32%
jan 1, 1976
22.546
+0.561
2.55%
jan 1, 1977
23.56
+1.014
4.5%
jan 1, 1978
26.036
+2.476
10.51%
jan 1, 1979
26.45
+0.414
1.59%
jan 1, 1980
26.794
+0.344
1.3%
jan 1, 1981
27.323
+0.529
1.98%
jan 1, 1982
27.632
+0.309
1.13%
jan 1, 1983
27.477
-0.156
-0.56%
jan 1, 1984
26.855
-0.621
-2.26%
jan 1, 1985
25.948
-0.907
-3.38%
jan 1, 1986
25.639
-0.309
-1.19%
jan 1, 1987
25.336
-0.303
-1.18%
jan 1, 1988
24.602
-0.734
-2.9%
jan 1, 1989
23.947
-0.655
-2.66%
jan 1, 1990
24.217
+0.27
1.13%
jan 1, 1991
25.267
+1.05
4.34%
jan 1, 1992
26.095
+0.828
3.28%
jan 1, 1993
27.165
+1.07
4.1%
jan 1, 1994
27.491
+0.326
1.2%
jan 1, 1995
26.466
-1.025
-3.73%
jan 1, 1996
25.52
-0.946
-3.57%
jan 1, 1997
25.89
+0.37
1.45%
jan 1, 1998
25.41
-0.48
-1.85%
jan 1, 1999
25.502
+0.091
0.36%
jan 1, 2000
25.429
-0.072
-0.28%
jan 1, 2001
24.537
-0.892
-3.51%
jan 1, 2002
24.722
+0.185
0.75%
jan 1, 2003
25.474
+0.752
3.04%
jan 1, 2004
25.712
+0.238
0.93%
jan 1, 2005
24.991
-0.721
-2.8%
jan 1, 2006
24.856
-0.135
-0.54%
jan 1, 2007
24.574
-0.282
-1.13%
jan 1, 2008
24.066
-0.508
-2.07%
jan 1, 2009
24.6
+0.535
2.22%
jan 1, 2010
26.169
+1.568
6.38%
jan 1, 2011
25.181
-0.988
-3.77%
jan 1, 2012
25.183
+0.001
0.01%
jan 1, 2013
25.915
+0.732
2.91%
jan 1, 2014
26.33
+0.416
1.6%
jan 1, 2015
26.201
-0.129
-0.49%
jan 1, 2016
25.942
-0.26
-0.99%
Ranking of countries by current statistics by years


Comments: