29
/
en
AIzaSyAYiBZKx7MnpbEhh9jyipgxe19OcubqV5w
April 1, 2024
215286
Oman
OMN
true
2
1
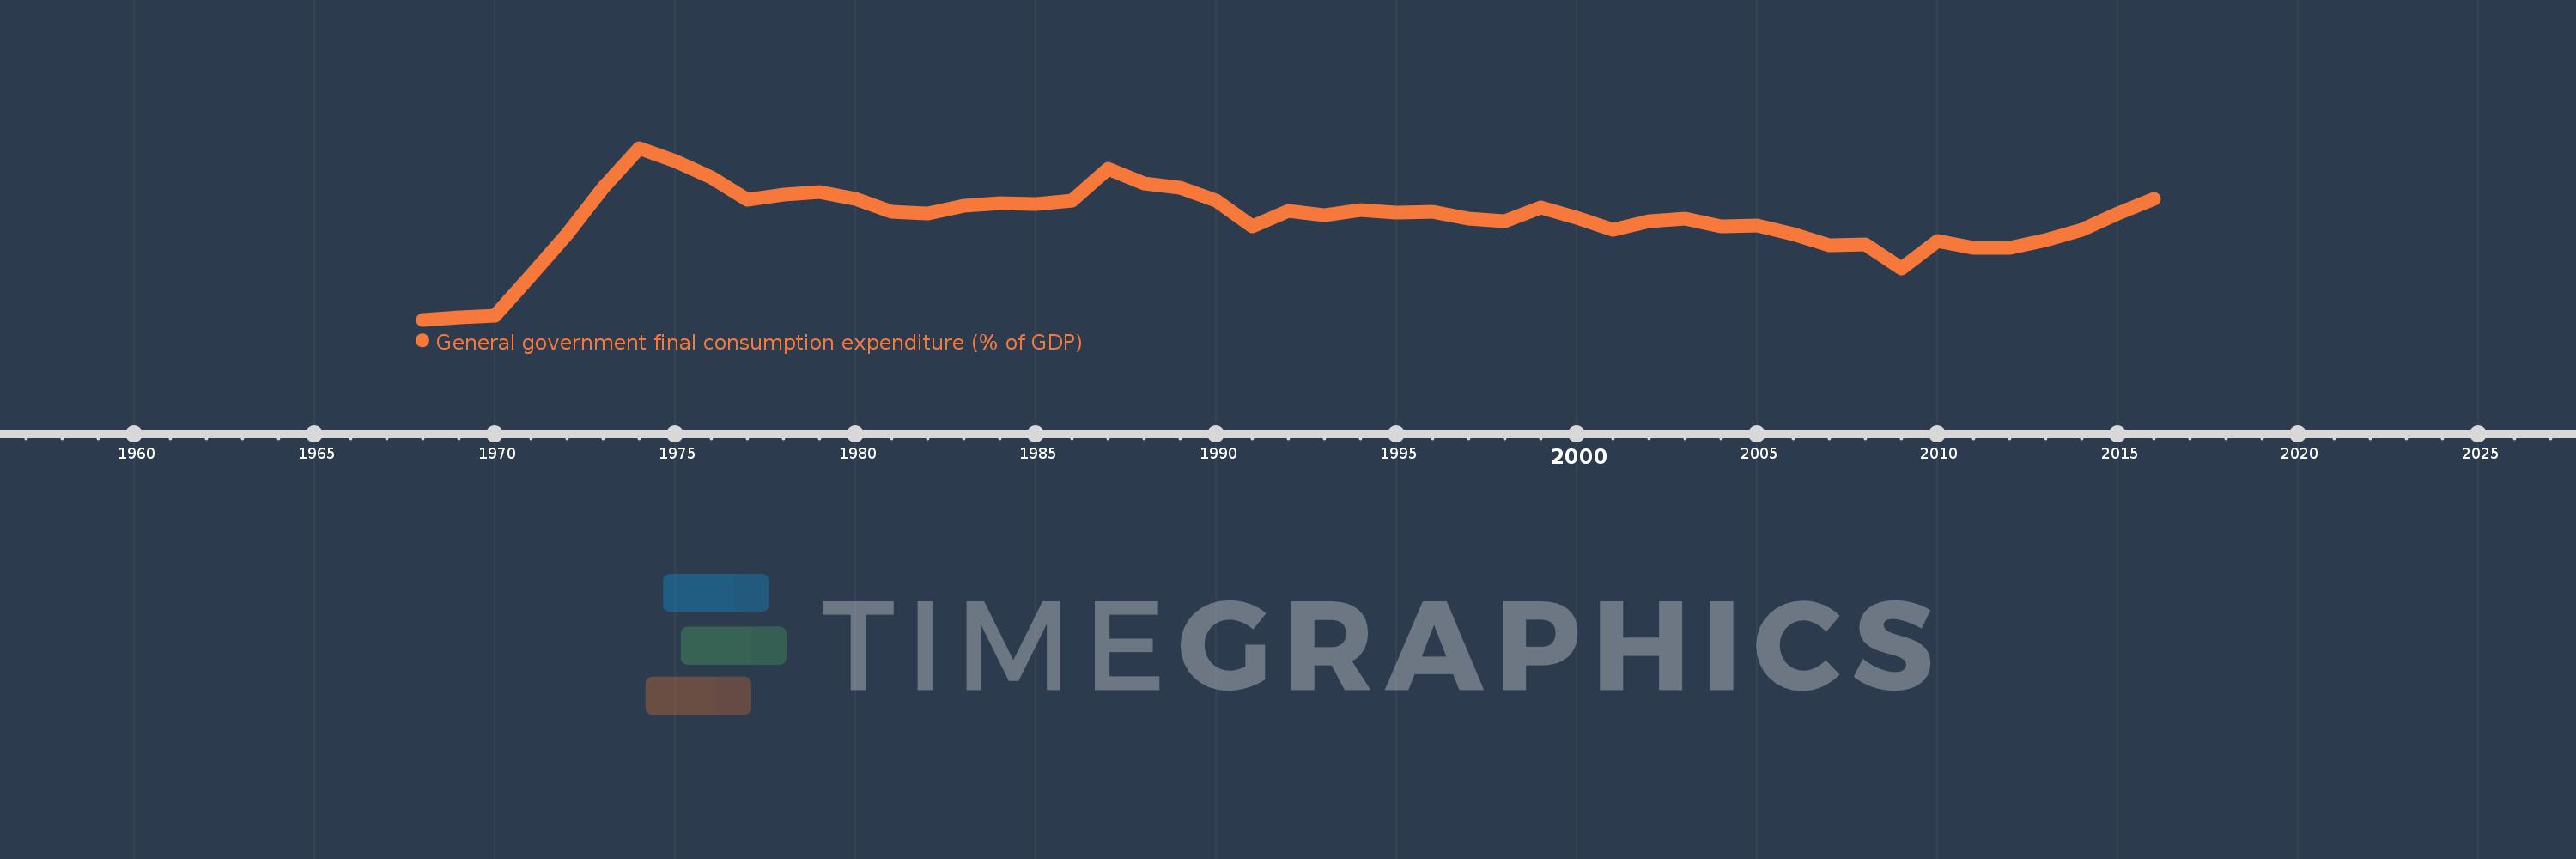
General government final consumption expenditure (% of GDP)
2016,2015,2014,2013,2012,2011,2010,2009,2008,2007,2006,2005,2004,2003,2002,2001,2000,1999,1998,1997,1996,1995,1994,1993,1992,1991,1990,1989,1988,1987,1986,1985,1984,1983,1982,1981,1980,1979,1978,1977,1976,1975,1974,1973,1972,1971,1970,1969,1968
This statistics in other country:
AfghanistanAlbaniaAlgeriaAngolaAntigua and BarbudaArab WorldArgentinaArmeniaArubaAustraliaAustriaAzerbaijanBahamas, TheBahrainBangladeshBarbadosBelarusBelgiumBelizeBeninBermudaBhutanBoliviaBosnia and HerzegovinaBotswanaBrazilBrunei DarussalamBulgariaBurkina FasoBurundiCabo VerdeCambodiaCameroonCanadaCaribbean small statesCentral African RepublicCentral Europe and the BalticsChadChileChinaColombiaComorosCongo, Dem. Rep.Congo, Rep.Costa RicaCote d'IvoireCroatiaCubaCyprusCzech RepublicDenmarkDjiboutiDominicaDominican RepublicEarly-demographic dividendEast Asia & PacificEast Asia & Pacific (excluding high income)East Asia & Pacific (IDA & IBRD countries)EcuadorEgypt, Arab Rep.El SalvadorEquatorial GuineaEritreaEstoniaEthiopiaEuro areaEurope & Central AsiaEurope & Central Asia (excluding high income)Europe & Central Asia (IDA & IBRD countries)European UnionFaroe IslandsFijiFinlandFragile and conflict affected situationsFranceFrench PolynesiaGabonGambia, TheGeorgiaGermanyGhanaGreeceGrenadaGuatemalaGuineaGuinea-BissauGuyanaHaitiHeavily indebted poor countries (HIPC)High incomeHondurasHong Kong SAR, ChinaHungaryIBRD onlyIcelandIDA & IBRD totalIDA blendIDA onlyIDA totalIndiaIndonesiaIran, Islamic Rep.IraqIrelandIsraelItalyJamaicaJapanJordanKazakhstanKenyaKiribatiKorea, Rep.KosovoKuwaitKyrgyz RepublicLao PDRLate-demographic dividendLatin America & Caribbean Latin America & Caribbean (excluding high income)Latin America & the Caribbean (IDA & IBRD countries)LatviaLeast developed countries: UN classificationLebanonLesothoLiberiaLibyaLithuaniaLow & middle incomeLow incomeLower middle incomeLuxembourgMacao SAR, ChinaMacedonia, FYRMadagascarMalawiMalaysiaMaldivesMaliMaltaMauritaniaMauritiusMexicoMicronesia, Fed. Sts.Middle East & North AfricaMiddle East & North Africa (excluding high income)Middle East & North Africa (IDA & IBRD countries)Middle incomeMoldovaMongoliaMontenegroMoroccoMozambiqueNamibiaNepalNetherlandsNew CaledoniaNew ZealandNicaraguaNigerNigeriaNorth AmericaNorwayOECD membersOmanOther small statesPacific island small statesPakistanPanamaPapua New GuineaParaguayPeruPhilippinesPolandPortugalPost-demographic dividendPre-demographic dividendPuerto RicoQatarRomaniaRussian FederationRwandaSaudi ArabiaSenegalSerbiaSeychellesSierra LeoneSingaporeSlovak RepublicSloveniaSmall statesSolomon IslandsSomaliaSouth AfricaSouth AsiaSouth Asia (IDA & IBRD)South SudanSpainSri LankaSt. Kitts and NevisSt. LuciaSt. Vincent and the GrenadinesSub-Saharan Africa Sub-Saharan Africa (excluding high income)Sub-Saharan Africa (IDA & IBRD countries)SudanSurinameSwazilandSwedenSwitzerlandSyrian Arab RepublicTajikistanTanzaniaThailandTimor-LesteTogoTongaTrinidad and TobagoTunisiaTurkeyTurkmenistanUgandaUkraineUnited Arab EmiratesUnited KingdomUnited StatesUpper middle incomeUruguayUzbekistanVanuatuVenezuela, RBVietnamWest Bank and GazaWorldYemen, Rep.ZambiaZimbabwe Timeline:
This timeline shows a graph from 1968 to 2016 of Oman. No data until 1967. Number of actual observations by date: 49.
Source name:
World Development Indicators
Source organization:
World Bank national accounts data, and OECD National Accounts data files.
Categories, topics:
Economy & Growth
Last updated:
apr 23, 2017
Indicators value changes by year
At the date of observation
Value
Absolute change
Change from previous value
jan 1, 1968
4.381
+4.381
0.0%
jan 1, 1969
4.828
+0.447
10.2%
jan 1, 1970
5.1
+0.272
5.62%
jan 1, 1971
12.828
+7.728
151.52%
jan 1, 1972
20.783
+7.956
62.02%
jan 1, 1973
29.616
+8.833
42.5%
jan 1, 1974
37.19
+7.574
25.57%
jan 1, 1975
34.688
-2.502
-6.73%
jan 1, 1976
31.621
-3.067
-8.84%
jan 1, 1977
27.242
-4.379
-13.85%
jan 1, 1978
28.359
+1.117
4.1%
jan 1, 1979
28.769
+0.41
1.45%
jan 1, 1980
27.507
-1.262
-4.39%
jan 1, 1981
25.008
-2.498
-9.08%
jan 1, 1982
24.596
-0.412
-1.65%
jan 1, 1983
26.106
+1.509
6.14%
jan 1, 1984
26.563
+0.457
1.75%
jan 1, 1985
26.519
-0.044
-0.17%
jan 1, 1986
27.145
+0.626
2.36%
jan 1, 1987
33.206
+6.061
22.33%
jan 1, 1988
30.422
-2.784
-8.38%
jan 1, 1989
29.648
-0.774
-2.54%
jan 1, 1990
27.073
-2.575
-8.69%
jan 1, 1991
22.29
-4.783
-17.67%
jan 1, 1992
25.12
+2.83
12.69%
jan 1, 1993
24.406
-0.714
-2.84%
jan 1, 1994
25.386
+0.98
4.02%
jan 1, 1995
24.919
-0.467
-1.84%
jan 1, 1996
25.082
+0.163
0.65%
jan 1, 1997
23.68
-1.403
-5.59%
jan 1, 1998
23.237
-0.443
-1.87%
jan 1, 1999
25.88
+2.643
11.37%
jan 1, 2000
23.834
-2.046
-7.91%
jan 1, 2001
21.482
-2.352
-9.87%
jan 1, 2002
23.157
+1.675
7.8%
jan 1, 2003
23.653
+0.496
2.14%
jan 1, 2004
22.246
-1.407
-5.95%
jan 1, 2005
22.421
+0.174
0.78%
jan 1, 2006
20.79
-1.631
-7.27%
jan 1, 2007
18.629
-2.161
-10.39%
jan 1, 2008
18.811
+0.182
0.98%
jan 1, 2009
14.162
-4.649
-24.71%
jan 1, 2010
19.355
+5.194
36.67%
jan 1, 2011
18.148
-1.207
-6.24%
jan 1, 2012
18.044
-0.104
-0.57%
jan 1, 2013
19.541
+1.497
8.3%
jan 1, 2014
21.531
+1.99
10.18%
jan 1, 2015
24.719
+3.188
14.81%
jan 1, 2016
27.445
+2.726
11.03%
Ranking of countries by current statistics by years


Comments: