29
/
en
AIzaSyAYiBZKx7MnpbEhh9jyipgxe19OcubqV5w
April 1, 2024
24898
Caribbean small states
CSS
false
2
1
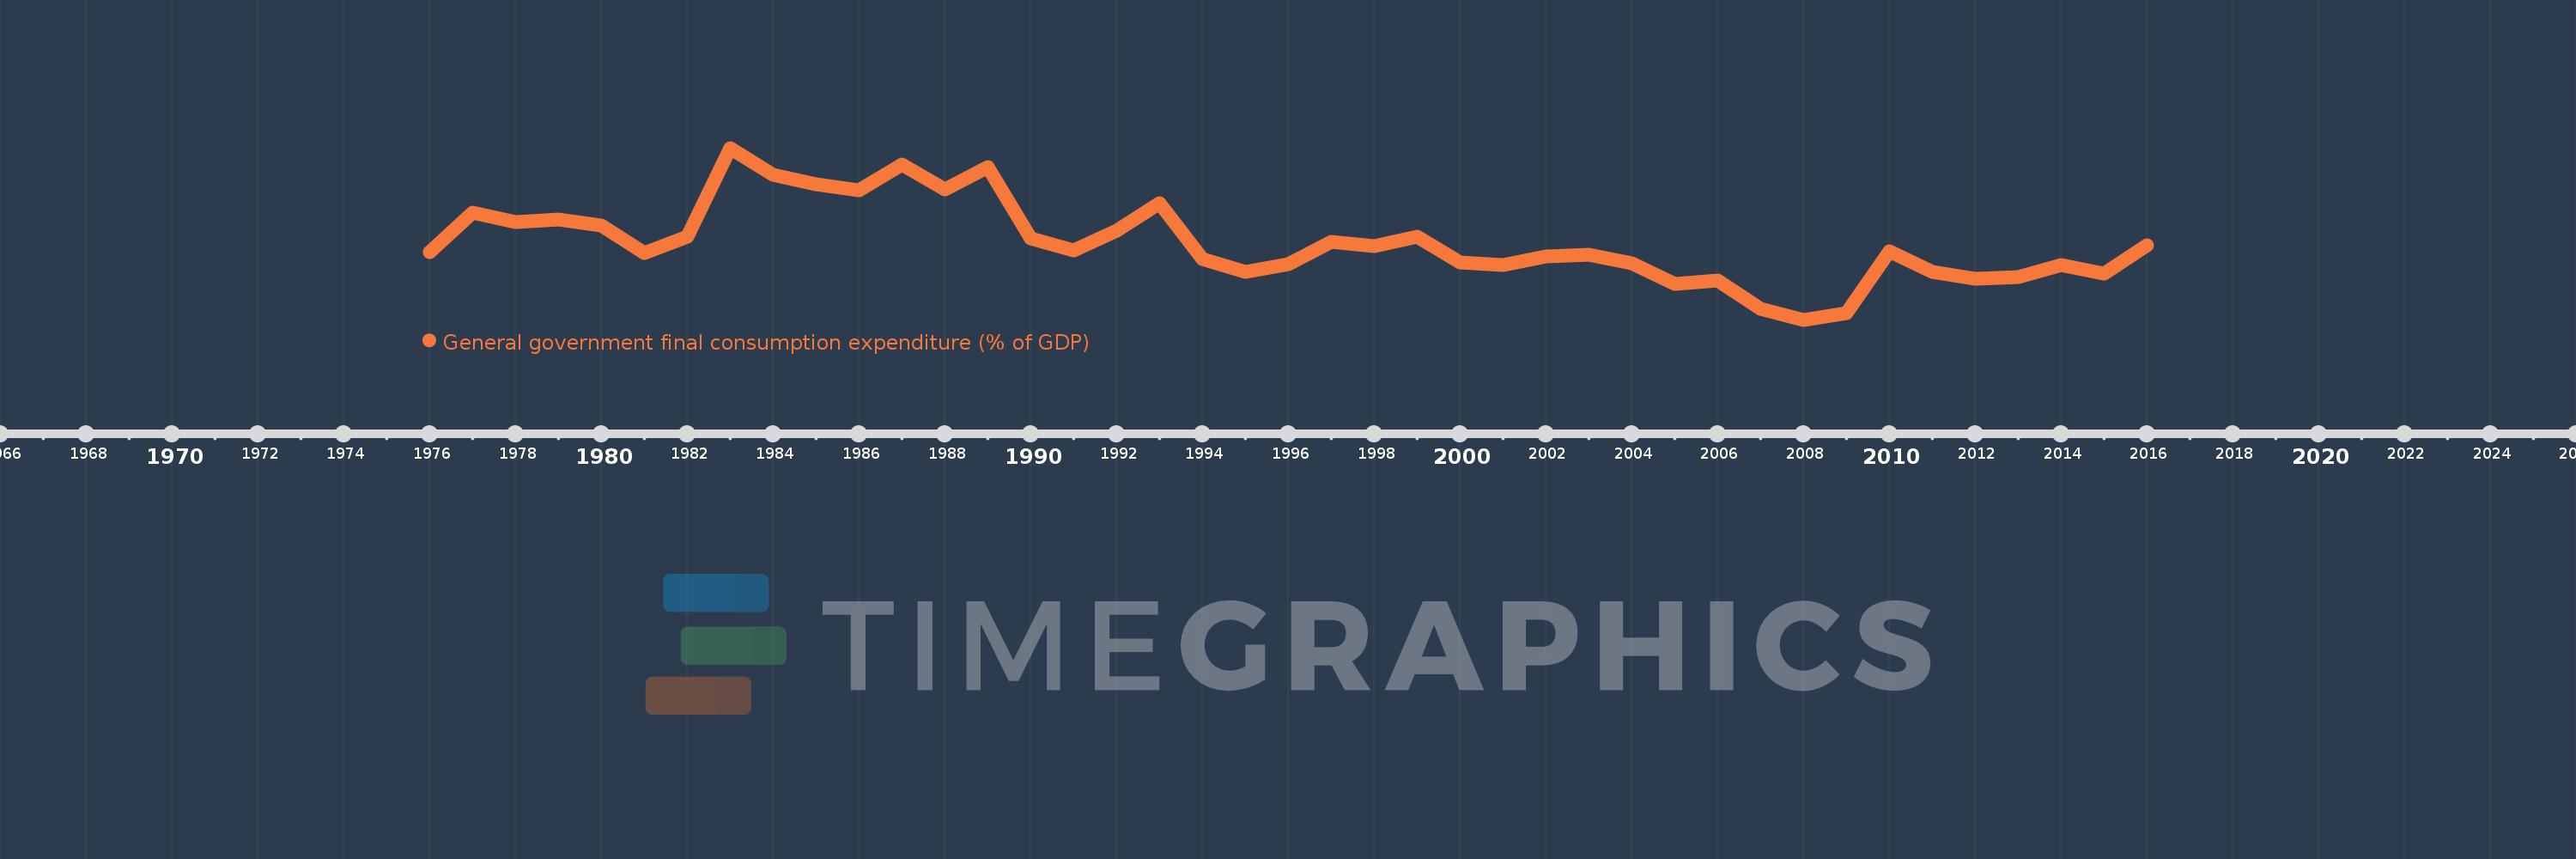
General government final consumption expenditure (% of GDP)
2016,2015,2014,2013,2012,2011,2010,2009,2008,2007,2006,2005,2004,2003,2002,2001,2000,1999,1998,1997,1996,1995,1994,1993,1992,1991,1990,1989,1988,1987,1986,1985,1984,1983,1982,1981,1980,1979,1978,1977,1976
This statistics in other country:
AfghanistanAlbaniaAlgeriaAngolaAntigua and BarbudaArab WorldArgentinaArmeniaArubaAustraliaAustriaAzerbaijanBahamas, TheBahrainBangladeshBarbadosBelarusBelgiumBelizeBeninBermudaBhutanBoliviaBosnia and HerzegovinaBotswanaBrazilBrunei DarussalamBulgariaBurkina FasoBurundiCabo VerdeCambodiaCameroonCanadaCaribbean small statesCentral African RepublicCentral Europe and the BalticsChadChileChinaColombiaComorosCongo, Dem. Rep.Congo, Rep.Costa RicaCote d'IvoireCroatiaCubaCyprusCzech RepublicDenmarkDjiboutiDominicaDominican RepublicEarly-demographic dividendEast Asia & PacificEast Asia & Pacific (excluding high income)East Asia & Pacific (IDA & IBRD countries)EcuadorEgypt, Arab Rep.El SalvadorEquatorial GuineaEritreaEstoniaEthiopiaEuro areaEurope & Central AsiaEurope & Central Asia (excluding high income)Europe & Central Asia (IDA & IBRD countries)European UnionFaroe IslandsFijiFinlandFragile and conflict affected situationsFranceFrench PolynesiaGabonGambia, TheGeorgiaGermanyGhanaGreeceGrenadaGuatemalaGuineaGuinea-BissauGuyanaHaitiHeavily indebted poor countries (HIPC)High incomeHondurasHong Kong SAR, ChinaHungaryIBRD onlyIcelandIDA & IBRD totalIDA blendIDA onlyIDA totalIndiaIndonesiaIran, Islamic Rep.IraqIrelandIsraelItalyJamaicaJapanJordanKazakhstanKenyaKiribatiKorea, Rep.KosovoKuwaitKyrgyz RepublicLao PDRLate-demographic dividendLatin America & Caribbean Latin America & Caribbean (excluding high income)Latin America & the Caribbean (IDA & IBRD countries)LatviaLeast developed countries: UN classificationLebanonLesothoLiberiaLibyaLithuaniaLow & middle incomeLow incomeLower middle incomeLuxembourgMacao SAR, ChinaMacedonia, FYRMadagascarMalawiMalaysiaMaldivesMaliMaltaMauritaniaMauritiusMexicoMicronesia, Fed. Sts.Middle East & North AfricaMiddle East & North Africa (excluding high income)Middle East & North Africa (IDA & IBRD countries)Middle incomeMoldovaMongoliaMontenegroMoroccoMozambiqueNamibiaNepalNetherlandsNew CaledoniaNew ZealandNicaraguaNigerNigeriaNorth AmericaNorwayOECD membersOmanOther small statesPacific island small statesPakistanPanamaPapua New GuineaParaguayPeruPhilippinesPolandPortugalPost-demographic dividendPre-demographic dividendPuerto RicoQatarRomaniaRussian FederationRwandaSaudi ArabiaSenegalSerbiaSeychellesSierra LeoneSingaporeSlovak RepublicSloveniaSmall statesSolomon IslandsSomaliaSouth AfricaSouth AsiaSouth Asia (IDA & IBRD)South SudanSpainSri LankaSt. Kitts and NevisSt. LuciaSt. Vincent and the GrenadinesSub-Saharan Africa Sub-Saharan Africa (excluding high income)Sub-Saharan Africa (IDA & IBRD countries)SudanSurinameSwazilandSwedenSwitzerlandSyrian Arab RepublicTajikistanTanzaniaThailandTimor-LesteTogoTongaTrinidad and TobagoTunisiaTurkeyTurkmenistanUgandaUkraineUnited Arab EmiratesUnited KingdomUnited StatesUpper middle incomeUruguayUzbekistanVanuatuVenezuela, RBVietnamWest Bank and GazaWorldYemen, Rep.ZambiaZimbabwe Timeline:
This timeline shows a graph from 1976 to 2016 of Caribbean small states. No data until 1975. Number of actual observations by date: 41.
Source name:
World Development Indicators
Source organization:
World Bank national accounts data, and OECD National Accounts data files.
Categories, topics:
Economy & Growth
Last updated:
apr 23, 2017
Indicators value changes by year
Minimum:
12.713
jan 1, 2008
Maximum:
19.725
jan 1, 1983
At the date of observation
Value
Absolute change
Change from previous value
jan 1, 1976
15.457
+15.457
0.0%
jan 1, 1977
17.081
+1.624
10.51%
jan 1, 1978
16.685
-0.396
-2.32%
jan 1, 1979
16.808
+0.123
0.74%
jan 1, 1980
16.543
-0.265
-1.58%
jan 1, 1981
15.433
-1.11
-6.71%
jan 1, 1982
16.095
+0.662
4.29%
jan 1, 1983
19.725
+3.631
22.56%
jan 1, 1984
18.635
-1.09
-5.53%
jan 1, 1985
18.227
-0.409
-2.19%
jan 1, 1986
17.989
-0.238
-1.3%
jan 1, 1987
19.034
+1.045
5.81%
jan 1, 1988
18.02
-1.014
-5.33%
jan 1, 1989
18.939
+0.919
5.1%
jan 1, 1990
16.022
-2.917
-15.4%
jan 1, 1991
15.528
-0.494
-3.08%
jan 1, 1992
16.352
+0.824
5.3%
jan 1, 1993
17.459
+1.108
6.77%
jan 1, 1994
15.18
-2.279
-13.05%
jan 1, 1995
14.669
-0.511
-3.37%
jan 1, 1996
14.989
+0.32
2.18%
jan 1, 1997
15.895
+0.906
6.04%
jan 1, 1998
15.717
-0.177
-1.12%
jan 1, 1999
16.091
+0.374
2.38%
jan 1, 2000
15.042
-1.049
-6.52%
jan 1, 2001
14.945
-0.097
-0.65%
jan 1, 2002
15.293
+0.348
2.33%
jan 1, 2003
15.363
+0.07
0.45%
jan 1, 2004
15.009
-0.354
-2.3%
jan 1, 2005
14.182
-0.827
-5.51%
jan 1, 2006
14.312
+0.13
0.92%
jan 1, 2007
13.173
-1.14
-7.96%
jan 1, 2008
12.713
-0.46
-3.49%
jan 1, 2009
13.0
+0.286
2.25%
jan 1, 2010
15.501
+2.502
19.24%
jan 1, 2011
14.678
-0.823
-5.31%
jan 1, 2012
14.396
-0.282
-1.92%
jan 1, 2013
14.468
+0.072
0.5%
jan 1, 2014
14.942
+0.474
3.28%
jan 1, 2015
14.596
-0.346
-2.32%
jan 1, 2016
15.759
+1.163
7.97%
Ranking of countries by current statistics by years


Comments: