29
/
en
AIzaSyAYiBZKx7MnpbEhh9jyipgxe19OcubqV5w
April 1, 2024
93575
Bulgaria
BGR
true
2
1
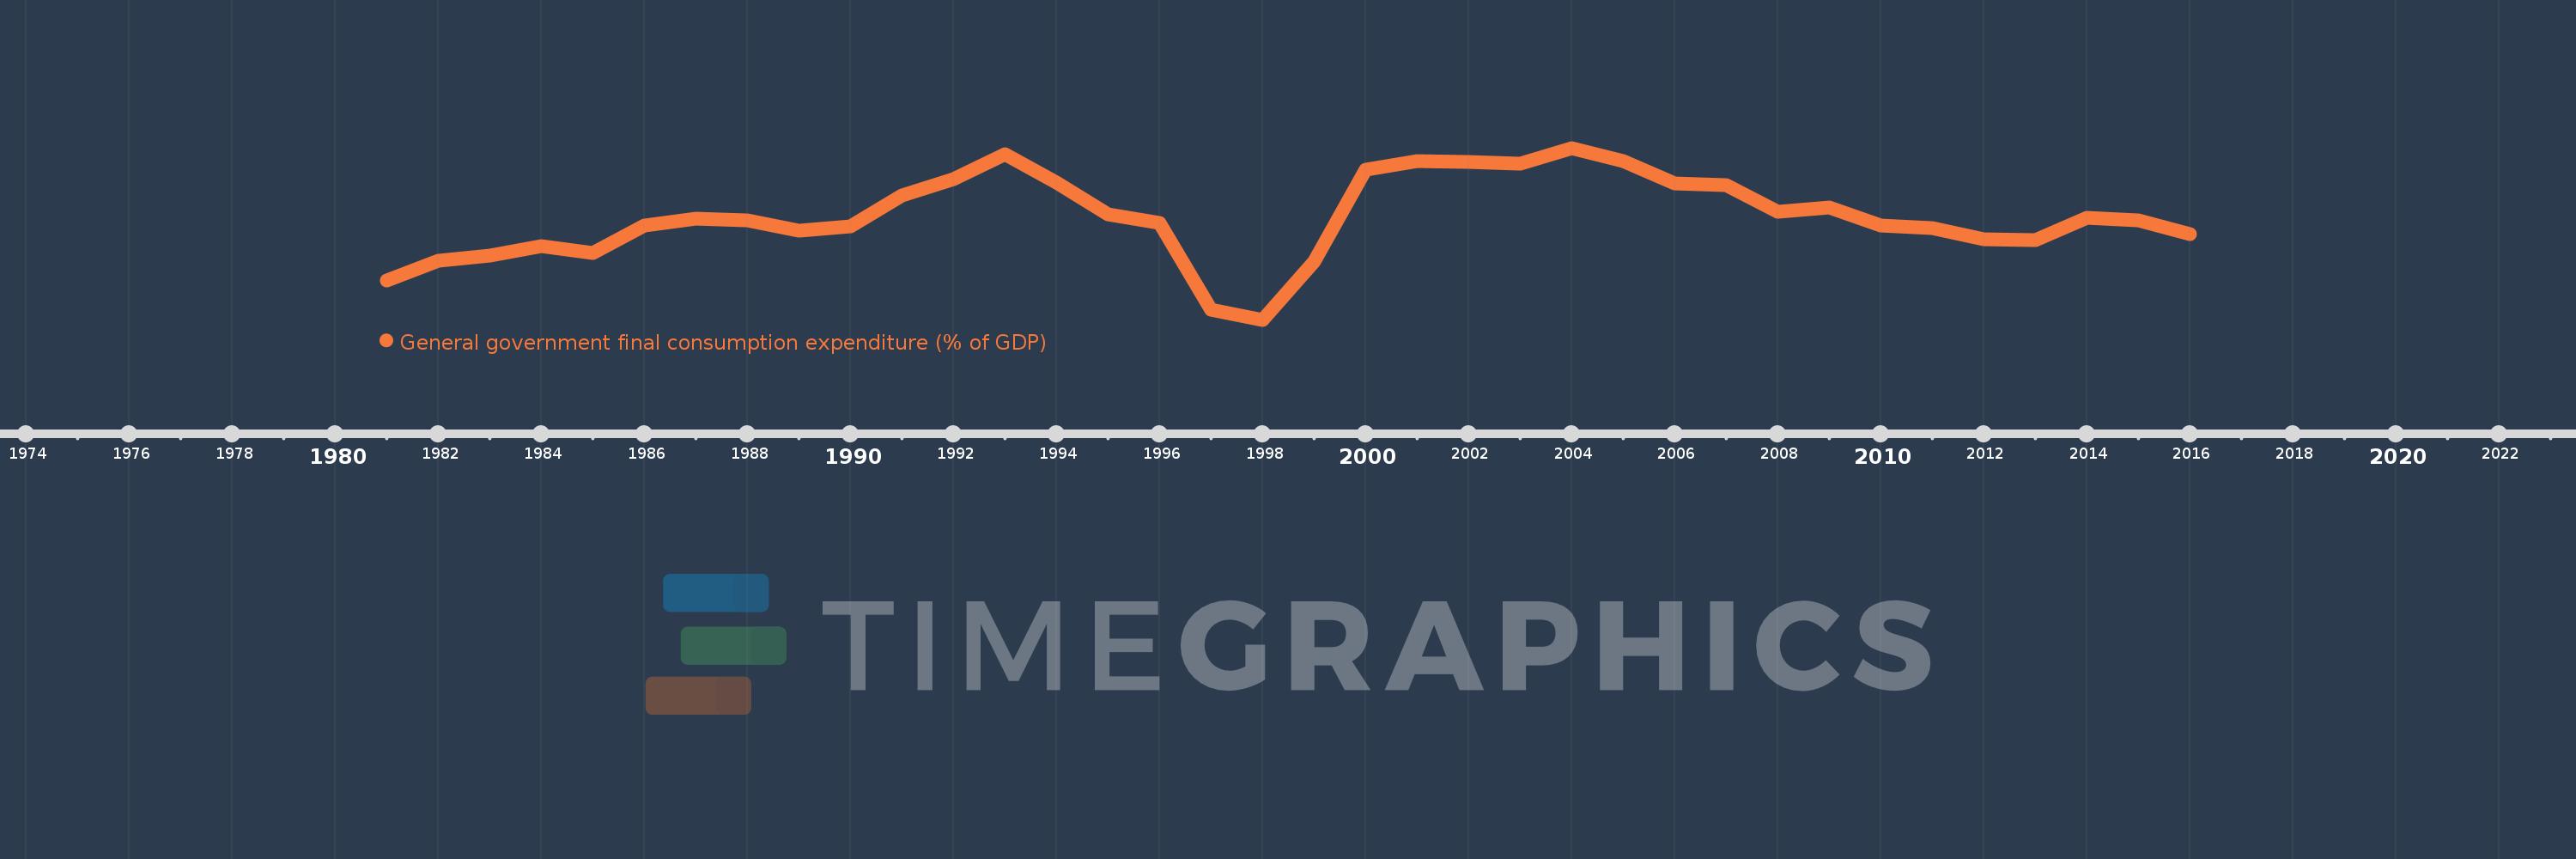
General government final consumption expenditure (% of GDP)
2016,2015,2014,2013,2012,2011,2010,2009,2008,2007,2006,2005,2004,2003,2002,2001,2000,1999,1998,1997,1996,1995,1994,1993,1992,1991,1990,1989,1988,1987,1986,1985,1984,1983,1982,1981
This statistics in other country:
AfghanistanAlbaniaAlgeriaAngolaAntigua and BarbudaArab WorldArgentinaArmeniaArubaAustraliaAustriaAzerbaijanBahamas, TheBahrainBangladeshBarbadosBelarusBelgiumBelizeBeninBermudaBhutanBoliviaBosnia and HerzegovinaBotswanaBrazilBrunei DarussalamBulgariaBurkina FasoBurundiCabo VerdeCambodiaCameroonCanadaCaribbean small statesCentral African RepublicCentral Europe and the BalticsChadChileChinaColombiaComorosCongo, Dem. Rep.Congo, Rep.Costa RicaCote d'IvoireCroatiaCubaCyprusCzech RepublicDenmarkDjiboutiDominicaDominican RepublicEarly-demographic dividendEast Asia & PacificEast Asia & Pacific (excluding high income)East Asia & Pacific (IDA & IBRD countries)EcuadorEgypt, Arab Rep.El SalvadorEquatorial GuineaEritreaEstoniaEthiopiaEuro areaEurope & Central AsiaEurope & Central Asia (excluding high income)Europe & Central Asia (IDA & IBRD countries)European UnionFaroe IslandsFijiFinlandFragile and conflict affected situationsFranceFrench PolynesiaGabonGambia, TheGeorgiaGermanyGhanaGreeceGrenadaGuatemalaGuineaGuinea-BissauGuyanaHaitiHeavily indebted poor countries (HIPC)High incomeHondurasHong Kong SAR, ChinaHungaryIBRD onlyIcelandIDA & IBRD totalIDA blendIDA onlyIDA totalIndiaIndonesiaIran, Islamic Rep.IraqIrelandIsraelItalyJamaicaJapanJordanKazakhstanKenyaKiribatiKorea, Rep.KosovoKuwaitKyrgyz RepublicLao PDRLate-demographic dividendLatin America & Caribbean Latin America & Caribbean (excluding high income)Latin America & the Caribbean (IDA & IBRD countries)LatviaLeast developed countries: UN classificationLebanonLesothoLiberiaLibyaLithuaniaLow & middle incomeLow incomeLower middle incomeLuxembourgMacao SAR, ChinaMacedonia, FYRMadagascarMalawiMalaysiaMaldivesMaliMaltaMauritaniaMauritiusMexicoMicronesia, Fed. Sts.Middle East & North AfricaMiddle East & North Africa (excluding high income)Middle East & North Africa (IDA & IBRD countries)Middle incomeMoldovaMongoliaMontenegroMoroccoMozambiqueNamibiaNepalNetherlandsNew CaledoniaNew ZealandNicaraguaNigerNigeriaNorth AmericaNorwayOECD membersOmanOther small statesPacific island small statesPakistanPanamaPapua New GuineaParaguayPeruPhilippinesPolandPortugalPost-demographic dividendPre-demographic dividendPuerto RicoQatarRomaniaRussian FederationRwandaSaudi ArabiaSenegalSerbiaSeychellesSierra LeoneSingaporeSlovak RepublicSloveniaSmall statesSolomon IslandsSomaliaSouth AfricaSouth AsiaSouth Asia (IDA & IBRD)South SudanSpainSri LankaSt. Kitts and NevisSt. LuciaSt. Vincent and the GrenadinesSub-Saharan Africa Sub-Saharan Africa (excluding high income)Sub-Saharan Africa (IDA & IBRD countries)SudanSurinameSwazilandSwedenSwitzerlandSyrian Arab RepublicTajikistanTanzaniaThailandTimor-LesteTogoTongaTrinidad and TobagoTunisiaTurkeyTurkmenistanUgandaUkraineUnited Arab EmiratesUnited KingdomUnited StatesUpper middle incomeUruguayUzbekistanVanuatuVenezuela, RBVietnamWest Bank and GazaWorldYemen, Rep.ZambiaZimbabwe Timeline:
This timeline shows a graph from 1981 to 2016 of Bulgaria. No data until 1980. Number of actual observations by date: 36.
Source name:
World Development Indicators
Source organization:
World Bank national accounts data, and OECD National Accounts data files.
Categories, topics:
Economy & Growth
Last updated:
apr 23, 2017
Indicators value changes by year
Minimum:
11.633
jan 1, 1998
Maximum:
20.678
jan 1, 2004
At the date of observation
Value
Absolute change
Change from previous value
jan 1, 1981
13.699
+13.699
0.0%
jan 1, 1982
14.735
+1.036
7.57%
jan 1, 1983
15.011
+0.275
1.87%
jan 1, 1984
15.496
+0.486
3.23%
jan 1, 1985
15.13
-0.366
-2.36%
jan 1, 1986
16.575
+1.445
9.55%
jan 1, 1987
16.948
+0.372
2.25%
jan 1, 1988
16.873
-0.075
-0.44%
jan 1, 1989
16.324
-0.549
-3.25%
jan 1, 1990
16.535
+0.211
1.29%
jan 1, 1991
18.187
+1.652
9.99%
jan 1, 1992
19.033
+0.847
4.65%
jan 1, 1993
20.336
+1.303
6.85%
jan 1, 1994
18.856
-1.48
-7.28%
jan 1, 1995
17.189
-1.666
-8.84%
jan 1, 1996
16.749
-0.44
-2.56%
jan 1, 1997
12.169
-4.58
-27.35%
jan 1, 1998
11.633
-0.536
-4.41%
jan 1, 1999
14.675
+3.042
26.15%
jan 1, 2000
19.525
+4.851
33.05%
jan 1, 2001
20.007
+0.482
2.47%
jan 1, 2002
19.961
-0.046
-0.23%
jan 1, 2003
19.829
-0.133
-0.66%
jan 1, 2004
20.678
+0.849
4.28%
jan 1, 2005
19.974
-0.704
-3.41%
jan 1, 2006
18.828
-1.145
-5.73%
jan 1, 2007
18.705
-0.123
-0.65%
jan 1, 2008
17.337
-1.368
-7.31%
jan 1, 2009
17.524
+0.187
1.08%
jan 1, 2010
16.585
-0.938
-5.35%
jan 1, 2011
16.477
-0.109
-0.65%
jan 1, 2012
15.848
-0.629
-3.82%
jan 1, 2013
15.81
-0.038
-0.24%
jan 1, 2014
16.987
+1.176
7.44%
jan 1, 2015
16.864
-0.123
-0.72%
jan 1, 2016
16.13
-0.734
-4.35%
Ranking of countries by current statistics by years


Comments: