29
/
en
AIzaSyAYiBZKx7MnpbEhh9jyipgxe19OcubqV5w
April 1, 2024
42391
Latin America & Caribbean (excluding high income)
LAC
false
2
1
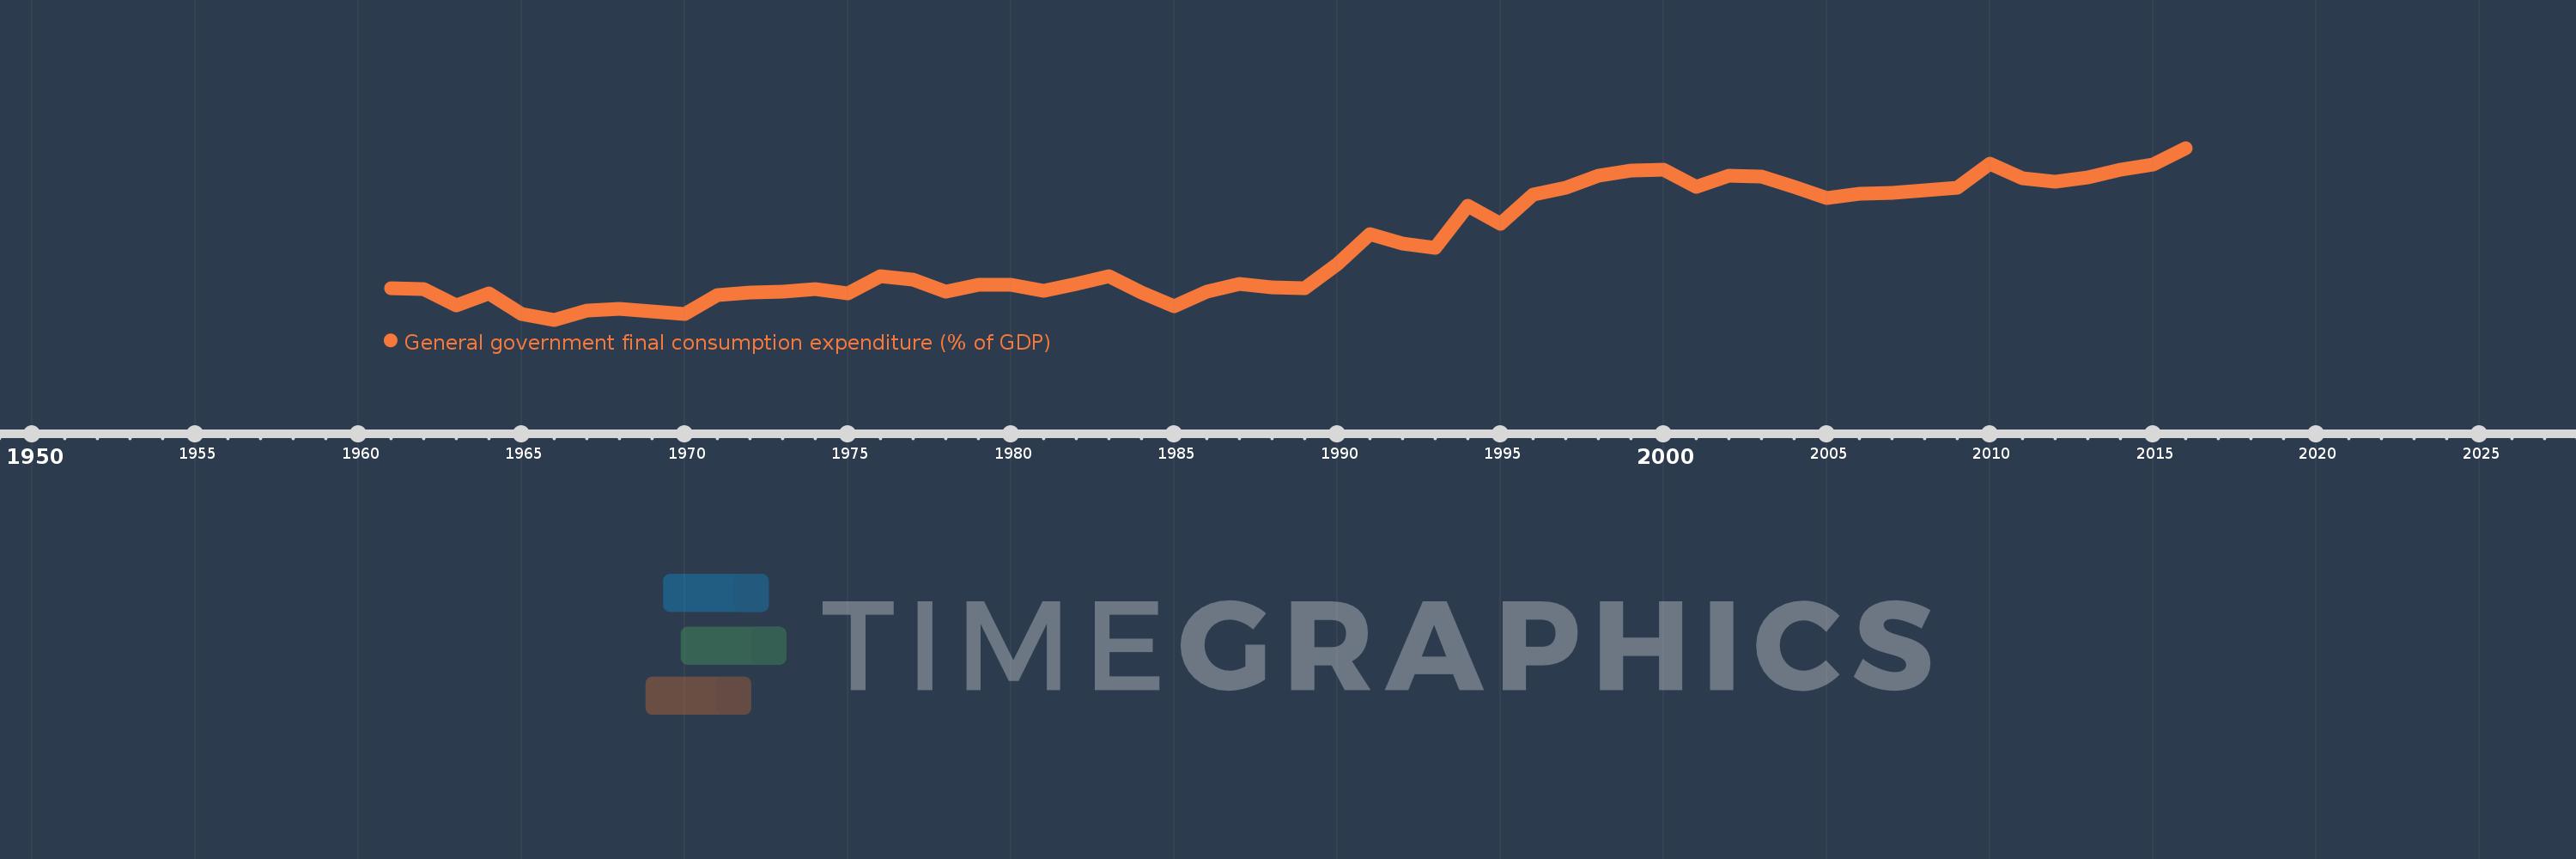
General government final consumption expenditure (% of GDP)
2016,2015,2014,2013,2012,2011,2010,2009,2008,2007,2006,2005,2004,2003,2002,2001,2000,1999,1998,1997,1996,1995,1994,1993,1992,1991,1990,1989,1988,1987,1986,1985,1984,1983,1982,1981,1980,1979,1978,1977,1976,1975,1974,1973,1972,1971,1970,1969,1968,1967,1966,1965,1964,1963,1962,1961
This statistics in other country:
AfghanistanAlbaniaAlgeriaAngolaAntigua and BarbudaArab WorldArgentinaArmeniaArubaAustraliaAustriaAzerbaijanBahamas, TheBahrainBangladeshBarbadosBelarusBelgiumBelizeBeninBermudaBhutanBoliviaBosnia and HerzegovinaBotswanaBrazilBrunei DarussalamBulgariaBurkina FasoBurundiCabo VerdeCambodiaCameroonCanadaCaribbean small statesCentral African RepublicCentral Europe and the BalticsChadChileChinaColombiaComorosCongo, Dem. Rep.Congo, Rep.Costa RicaCote d'IvoireCroatiaCubaCyprusCzech RepublicDenmarkDjiboutiDominicaDominican RepublicEarly-demographic dividendEast Asia & PacificEast Asia & Pacific (excluding high income)East Asia & Pacific (IDA & IBRD countries)EcuadorEgypt, Arab Rep.El SalvadorEquatorial GuineaEritreaEstoniaEthiopiaEuro areaEurope & Central AsiaEurope & Central Asia (excluding high income)Europe & Central Asia (IDA & IBRD countries)European UnionFaroe IslandsFijiFinlandFragile and conflict affected situationsFranceFrench PolynesiaGabonGambia, TheGeorgiaGermanyGhanaGreeceGrenadaGuatemalaGuineaGuinea-BissauGuyanaHaitiHeavily indebted poor countries (HIPC)High incomeHondurasHong Kong SAR, ChinaHungaryIBRD onlyIcelandIDA & IBRD totalIDA blendIDA onlyIDA totalIndiaIndonesiaIran, Islamic Rep.IraqIrelandIsraelItalyJamaicaJapanJordanKazakhstanKenyaKiribatiKorea, Rep.KosovoKuwaitKyrgyz RepublicLao PDRLate-demographic dividendLatin America & Caribbean Latin America & Caribbean (excluding high income)Latin America & the Caribbean (IDA & IBRD countries)LatviaLeast developed countries: UN classificationLebanonLesothoLiberiaLibyaLithuaniaLow & middle incomeLow incomeLower middle incomeLuxembourgMacao SAR, ChinaMacedonia, FYRMadagascarMalawiMalaysiaMaldivesMaliMaltaMauritaniaMauritiusMexicoMicronesia, Fed. Sts.Middle East & North AfricaMiddle East & North Africa (excluding high income)Middle East & North Africa (IDA & IBRD countries)Middle incomeMoldovaMongoliaMontenegroMoroccoMozambiqueNamibiaNepalNetherlandsNew CaledoniaNew ZealandNicaraguaNigerNigeriaNorth AmericaNorwayOECD membersOmanOther small statesPacific island small statesPakistanPanamaPapua New GuineaParaguayPeruPhilippinesPolandPortugalPost-demographic dividendPre-demographic dividendPuerto RicoQatarRomaniaRussian FederationRwandaSaudi ArabiaSenegalSerbiaSeychellesSierra LeoneSingaporeSlovak RepublicSloveniaSmall statesSolomon IslandsSomaliaSouth AfricaSouth AsiaSouth Asia (IDA & IBRD)South SudanSpainSri LankaSt. Kitts and NevisSt. LuciaSt. Vincent and the GrenadinesSub-Saharan Africa Sub-Saharan Africa (excluding high income)Sub-Saharan Africa (IDA & IBRD countries)SudanSurinameSwazilandSwedenSwitzerlandSyrian Arab RepublicTajikistanTanzaniaThailandTimor-LesteTogoTongaTrinidad and TobagoTunisiaTurkeyTurkmenistanUgandaUkraineUnited Arab EmiratesUnited KingdomUnited StatesUpper middle incomeUruguayUzbekistanVanuatuVenezuela, RBVietnamWest Bank and GazaWorldYemen, Rep.ZambiaZimbabwe Timeline:
This timeline shows a graph from 1961 to 2016 of Latin America & Caribbean (excluding high income). No data until 1960. Number of actual observations by date: 56.
Source name:
World Development Indicators
Source organization:
World Bank national accounts data, and OECD National Accounts data files.
Categories, topics:
Economy & Growth
Last updated:
apr 23, 2017
Indicators value changes by year
Maximum:
17.142
jan 1, 2016
At the date of observation
Value
Absolute change
Change from previous value
jan 1, 1961
10.645
+10.645
0.0%
jan 1, 1962
10.636
-0.009
-0.08%
jan 1, 1963
9.886
-0.75
-7.05%
jan 1, 1964
10.413
+0.528
5.34%
jan 1, 1965
9.478
-0.936
-8.99%
jan 1, 1966
9.205
-0.273
-2.88%
jan 1, 1967
9.641
+0.436
4.74%
jan 1, 1968
9.71
+0.07
0.72%
jan 1, 1969
9.599
-0.111
-1.14%
jan 1, 1970
9.487
-0.112
-1.17%
jan 1, 1971
10.348
+0.861
9.07%
jan 1, 1972
10.48
+0.132
1.28%
jan 1, 1973
10.484
+0.004
0.03%
jan 1, 1974
10.633
+0.15
1.43%
jan 1, 1975
10.418
-0.215
-2.03%
jan 1, 1976
11.233
+0.815
7.82%
jan 1, 1977
11.053
-0.18
-1.6%
jan 1, 1978
10.513
-0.54
-4.88%
jan 1, 1979
10.801
+0.288
2.73%
jan 1, 1980
10.801
0.0
0.0%
jan 1, 1981
10.555
-0.246
-2.27%
jan 1, 1982
10.873
+0.318
3.01%
jan 1, 1983
11.2
+0.326
3.0%
jan 1, 1984
10.478
-0.721
-6.44%
jan 1, 1985
9.822
-0.656
-6.26%
jan 1, 1986
10.495
+0.673
6.85%
jan 1, 1987
10.866
+0.371
3.54%
jan 1, 1988
10.708
-0.158
-1.46%
jan 1, 1989
10.656
-0.053
-0.49%
jan 1, 1990
11.786
+1.131
10.61%
jan 1, 1991
13.152
+1.365
11.59%
jan 1, 1992
12.726
-0.425
-3.24%
jan 1, 1993
12.525
-0.201
-1.58%
jan 1, 1994
14.489
+1.963
15.68%
jan 1, 1995
13.63
-0.858
-5.93%
jan 1, 1996
15.005
+1.375
10.09%
jan 1, 1997
15.312
+0.308
2.05%
jan 1, 1998
15.865
+0.552
3.61%
jan 1, 1999
16.098
+0.234
1.47%
jan 1, 2000
16.129
+0.03
0.19%
jan 1, 2001
15.347
-0.781
-4.84%
jan 1, 2002
15.874
+0.526
3.43%
jan 1, 2003
15.828
-0.046
-0.29%
jan 1, 2004
15.35
-0.477
-3.02%
jan 1, 2005
14.838
-0.513
-3.34%
jan 1, 2006
15.027
+0.19
1.28%
jan 1, 2007
15.053
+0.025
0.17%
jan 1, 2008
15.174
+0.121
0.81%
jan 1, 2009
15.306
+0.132
0.87%
jan 1, 2010
16.435
+1.129
7.37%
jan 1, 2011
15.749
-0.686
-4.17%
jan 1, 2012
15.594
-0.156
-0.99%
jan 1, 2013
15.768
+0.175
1.12%
jan 1, 2014
16.152
+0.384
2.43%
jan 1, 2015
16.382
+0.23
1.42%
jan 1, 2016
17.142
+0.76
4.64%
Ranking of countries by current statistics by years


Comments: