29
/
en
AIzaSyAYiBZKx7MnpbEhh9jyipgxe19OcubqV5w
April 1, 2024
276653
United States
USA
true
2
1
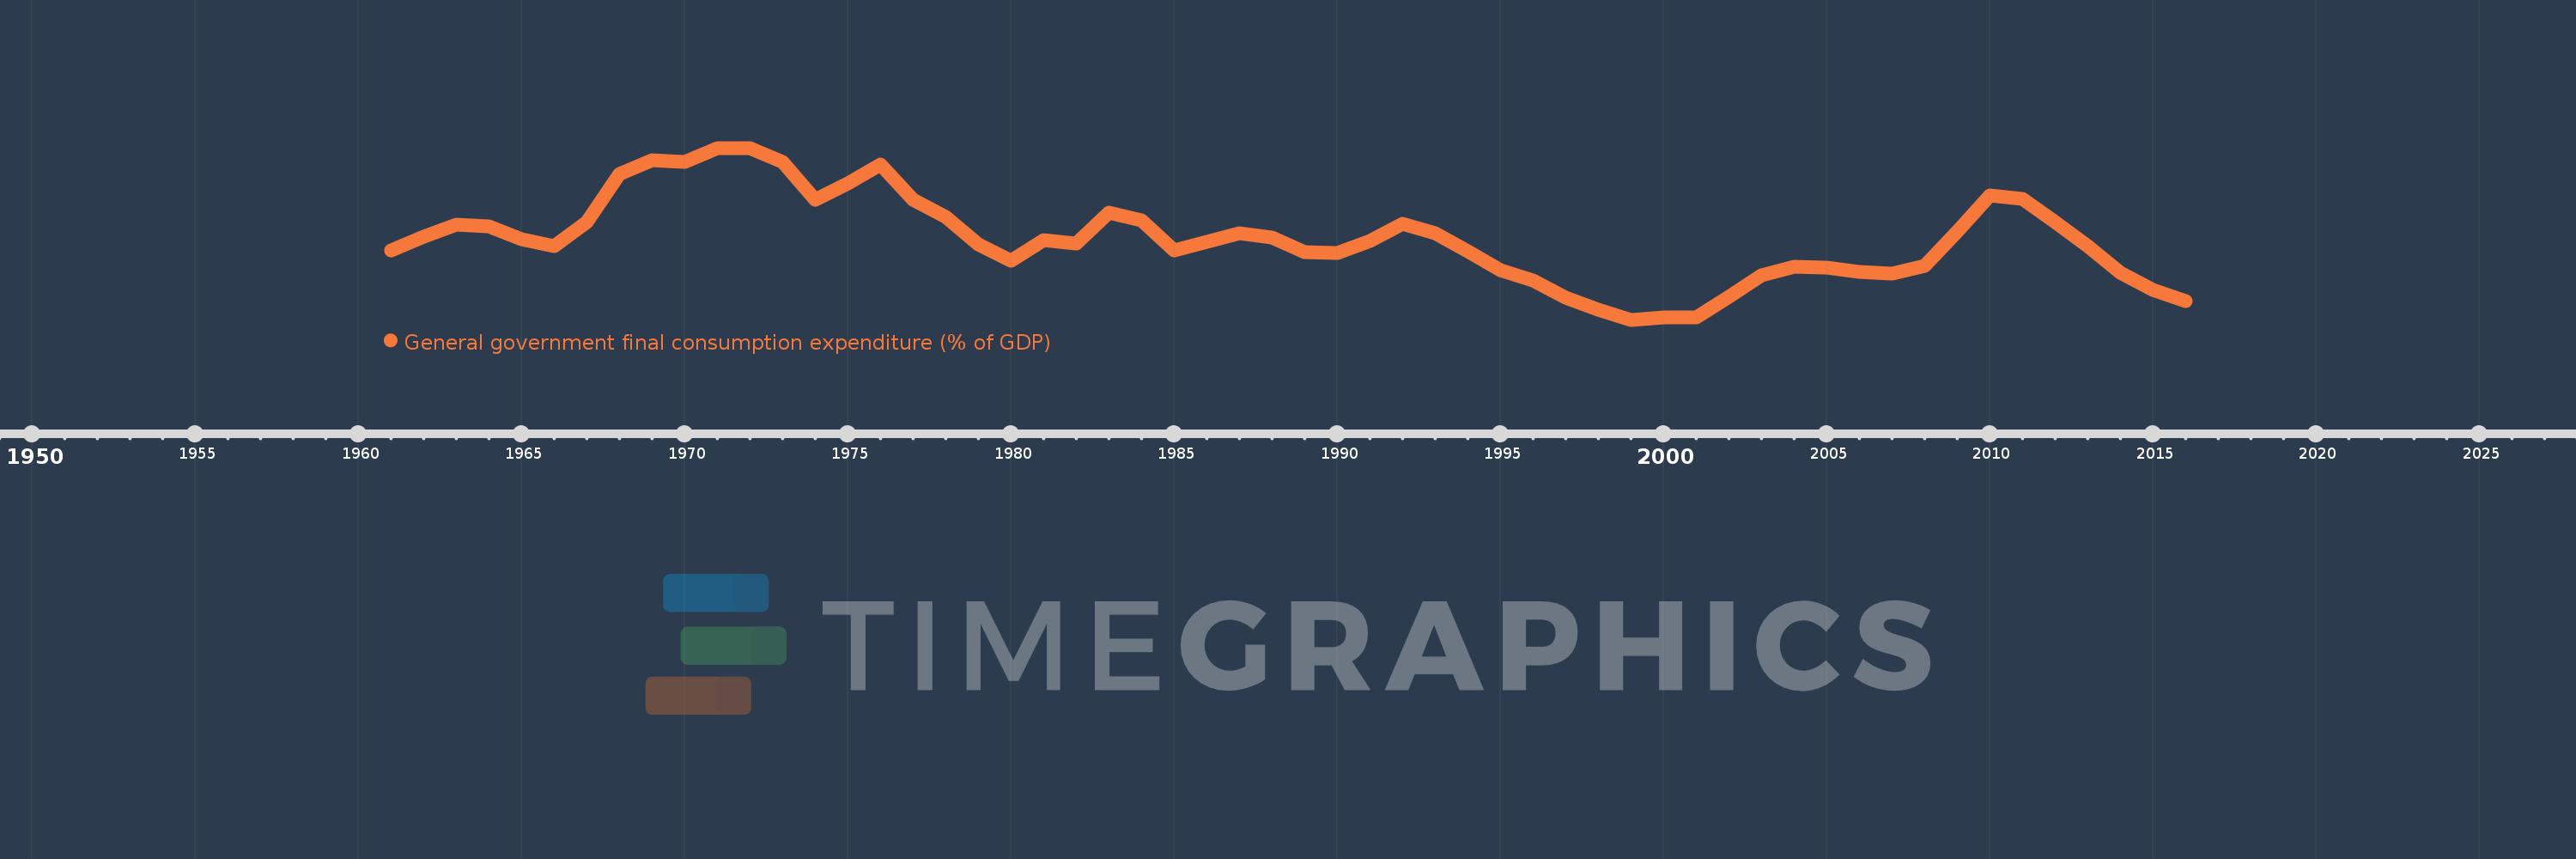
General government final consumption expenditure (% of GDP)
2016,2015,2014,2013,2012,2011,2010,2009,2008,2007,2006,2005,2004,2003,2002,2001,2000,1999,1998,1997,1996,1995,1994,1993,1992,1991,1990,1989,1988,1987,1986,1985,1984,1983,1982,1981,1980,1979,1978,1977,1976,1975,1974,1973,1972,1971,1970,1969,1968,1967,1966,1965,1964,1963,1962,1961
This statistics in other country:
AfghanistanAlbaniaAlgeriaAngolaAntigua and BarbudaArab WorldArgentinaArmeniaArubaAustraliaAustriaAzerbaijanBahamas, TheBahrainBangladeshBarbadosBelarusBelgiumBelizeBeninBermudaBhutanBoliviaBosnia and HerzegovinaBotswanaBrazilBrunei DarussalamBulgariaBurkina FasoBurundiCabo VerdeCambodiaCameroonCanadaCaribbean small statesCentral African RepublicCentral Europe and the BalticsChadChileChinaColombiaComorosCongo, Dem. Rep.Congo, Rep.Costa RicaCote d'IvoireCroatiaCubaCyprusCzech RepublicDenmarkDjiboutiDominicaDominican RepublicEarly-demographic dividendEast Asia & PacificEast Asia & Pacific (excluding high income)East Asia & Pacific (IDA & IBRD countries)EcuadorEgypt, Arab Rep.El SalvadorEquatorial GuineaEritreaEstoniaEthiopiaEuro areaEurope & Central AsiaEurope & Central Asia (excluding high income)Europe & Central Asia (IDA & IBRD countries)European UnionFaroe IslandsFijiFinlandFragile and conflict affected situationsFranceFrench PolynesiaGabonGambia, TheGeorgiaGermanyGhanaGreeceGrenadaGuatemalaGuineaGuinea-BissauGuyanaHaitiHeavily indebted poor countries (HIPC)High incomeHondurasHong Kong SAR, ChinaHungaryIBRD onlyIcelandIDA & IBRD totalIDA blendIDA onlyIDA totalIndiaIndonesiaIran, Islamic Rep.IraqIrelandIsraelItalyJamaicaJapanJordanKazakhstanKenyaKiribatiKorea, Rep.KosovoKuwaitKyrgyz RepublicLao PDRLate-demographic dividendLatin America & Caribbean Latin America & Caribbean (excluding high income)Latin America & the Caribbean (IDA & IBRD countries)LatviaLeast developed countries: UN classificationLebanonLesothoLiberiaLibyaLithuaniaLow & middle incomeLow incomeLower middle incomeLuxembourgMacao SAR, ChinaMacedonia, FYRMadagascarMalawiMalaysiaMaldivesMaliMaltaMauritaniaMauritiusMexicoMicronesia, Fed. Sts.Middle East & North AfricaMiddle East & North Africa (excluding high income)Middle East & North Africa (IDA & IBRD countries)Middle incomeMoldovaMongoliaMontenegroMoroccoMozambiqueNamibiaNepalNetherlandsNew CaledoniaNew ZealandNicaraguaNigerNigeriaNorth AmericaNorwayOECD membersOmanOther small statesPacific island small statesPakistanPanamaPapua New GuineaParaguayPeruPhilippinesPolandPortugalPost-demographic dividendPre-demographic dividendPuerto RicoQatarRomaniaRussian FederationRwandaSaudi ArabiaSenegalSerbiaSeychellesSierra LeoneSingaporeSlovak RepublicSloveniaSmall statesSolomon IslandsSomaliaSouth AfricaSouth AsiaSouth Asia (IDA & IBRD)South SudanSpainSri LankaSt. Kitts and NevisSt. LuciaSt. Vincent and the GrenadinesSub-Saharan Africa Sub-Saharan Africa (excluding high income)Sub-Saharan Africa (IDA & IBRD countries)SudanSurinameSwazilandSwedenSwitzerlandSyrian Arab RepublicTajikistanTanzaniaThailandTimor-LesteTogoTongaTrinidad and TobagoTunisiaTurkeyTurkmenistanUgandaUkraineUnited Arab EmiratesUnited KingdomUnited StatesUpper middle incomeUruguayUzbekistanVanuatuVenezuela, RBVietnamWest Bank and GazaWorldYemen, Rep.ZambiaZimbabwe Timeline:
This timeline shows a graph from 1961 to 2016 of United States. No data until 1960. Number of actual observations by date: 56.
Source name:
World Development Indicators
Source organization:
World Bank national accounts data, and OECD National Accounts data files.
Categories, topics:
Economy & Growth
Last updated:
apr 23, 2017
Indicators value changes by year
Minimum:
13.996
jan 1, 1999
Maximum:
18.069
jan 1, 1971
At the date of observation
Value
Absolute change
Change from previous value
jan 1, 1961
15.645
+15.645
0.0%
jan 1, 1962
15.96
+0.314
2.01%
jan 1, 1963
16.245
+0.286
1.79%
jan 1, 1964
16.207
-0.038
-0.23%
jan 1, 1965
15.908
-0.299
-1.84%
jan 1, 1966
15.732
-0.176
-1.11%
jan 1, 1967
16.307
+0.575
3.65%
jan 1, 1968
17.454
+1.147
7.03%
jan 1, 1969
17.772
+0.318
1.82%
jan 1, 1970
17.727
-0.045
-0.25%
jan 1, 1971
18.069
+0.342
1.93%
jan 1, 1972
18.053
-0.016
-0.09%
jan 1, 1973
17.744
-0.31
-1.72%
jan 1, 1974
16.851
-0.893
-5.03%
jan 1, 1975
17.236
+0.385
2.28%
jan 1, 1976
17.676
+0.441
2.56%
jan 1, 1977
16.84
-0.836
-4.73%
jan 1, 1978
16.424
-0.416
-2.47%
jan 1, 1979
15.778
-0.646
-3.93%
jan 1, 1980
15.403
-0.375
-2.38%
jan 1, 1981
15.892
+0.488
3.17%
jan 1, 1982
15.802
-0.09
-0.56%
jan 1, 1983
16.534
+0.733
4.64%
jan 1, 1984
16.343
-0.191
-1.16%
jan 1, 1985
15.641
-0.702
-4.3%
jan 1, 1986
15.841
+0.2
1.28%
jan 1, 1987
16.043
+0.202
1.27%
jan 1, 1988
15.936
-0.107
-0.66%
jan 1, 1989
15.607
-0.329
-2.07%
jan 1, 1990
15.58
-0.027
-0.17%
jan 1, 1991
15.854
+0.273
1.76%
jan 1, 1992
16.263
+0.409
2.58%
jan 1, 1993
16.045
-0.217
-1.34%
jan 1, 1994
15.616
-0.429
-2.68%
jan 1, 1995
15.181
-0.435
-2.78%
jan 1, 1996
14.933
-0.248
-1.64%
jan 1, 1997
14.524
-0.409
-2.74%
jan 1, 1998
14.226
-0.299
-2.06%
jan 1, 1999
13.996
-0.23
-1.62%
jan 1, 2000
14.053
+0.057
0.41%
jan 1, 2001
14.042
-0.011
-0.08%
jan 1, 2002
14.547
+0.505
3.6%
jan 1, 2003
15.043
+0.496
3.41%
jan 1, 2004
15.252
+0.209
1.39%
jan 1, 2005
15.226
-0.026
-0.17%
jan 1, 2006
15.122
-0.104
-0.68%
jan 1, 2007
15.083
-0.039
-0.26%
jan 1, 2008
15.263
+0.18
1.2%
jan 1, 2009
16.092
+0.829
5.43%
jan 1, 2010
16.937
+0.844
5.25%
jan 1, 2011
16.855
-0.082
-0.48%
jan 1, 2012
16.309
-0.545
-3.24%
jan 1, 2013
15.748
-0.561
-3.44%
jan 1, 2014
15.12
-0.628
-3.99%
jan 1, 2015
14.704
-0.415
-2.75%
jan 1, 2016
14.442
-0.262
-1.78%
Ranking of countries by current statistics by years


Comments: