29
/
en
AIzaSyAYiBZKx7MnpbEhh9jyipgxe19OcubqV5w
April 1, 2024
146851
Guinea-Bissau
GNB
true
2
1
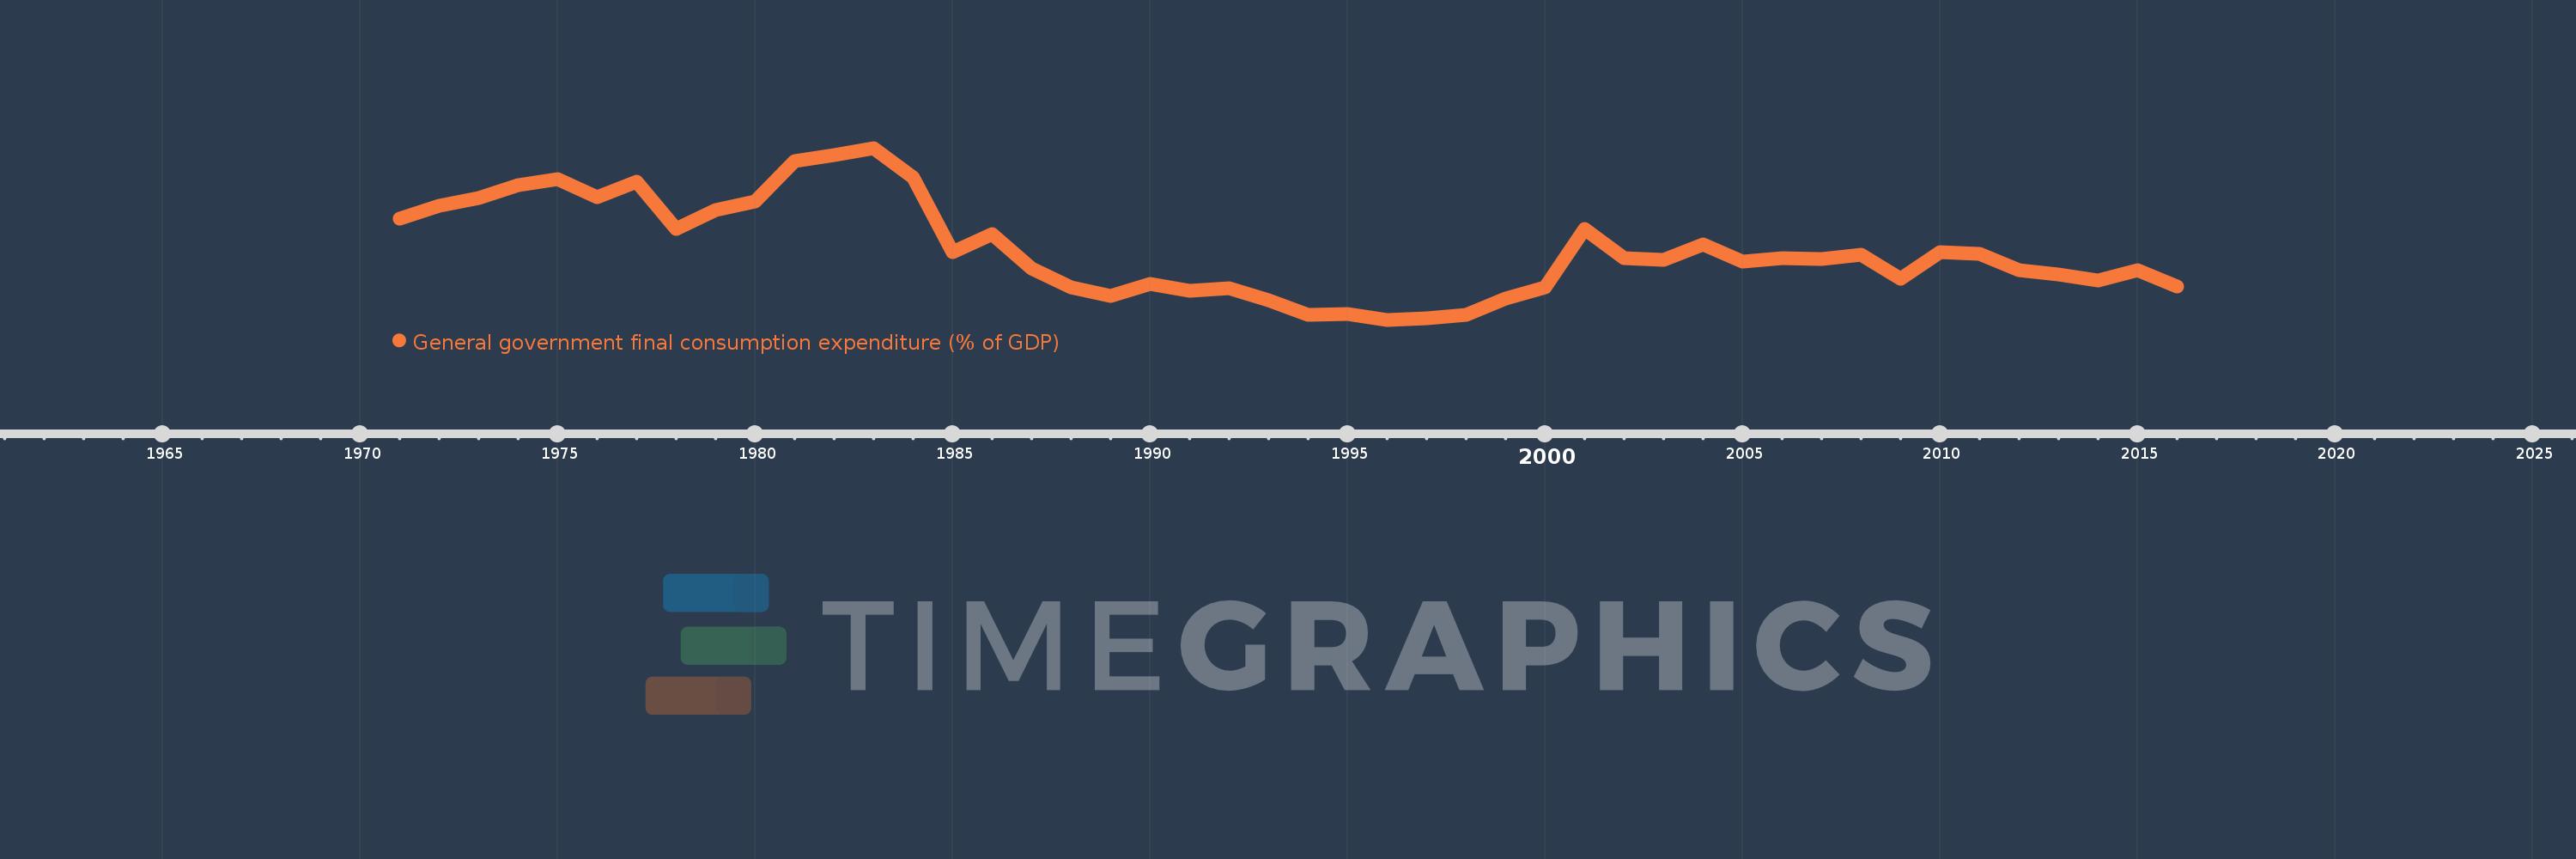
General government final consumption expenditure (% of GDP)
2016,2015,2014,2013,2012,2011,2010,2009,2008,2007,2006,2005,2004,2003,2002,2001,2000,1999,1998,1997,1996,1995,1994,1993,1992,1991,1990,1989,1988,1987,1986,1985,1984,1983,1982,1981,1980,1979,1978,1977,1976,1975,1974,1973,1972,1971
This statistics in other country:
AfghanistanAlbaniaAlgeriaAngolaAntigua and BarbudaArab WorldArgentinaArmeniaArubaAustraliaAustriaAzerbaijanBahamas, TheBahrainBangladeshBarbadosBelarusBelgiumBelizeBeninBermudaBhutanBoliviaBosnia and HerzegovinaBotswanaBrazilBrunei DarussalamBulgariaBurkina FasoBurundiCabo VerdeCambodiaCameroonCanadaCaribbean small statesCentral African RepublicCentral Europe and the BalticsChadChileChinaColombiaComorosCongo, Dem. Rep.Congo, Rep.Costa RicaCote d'IvoireCroatiaCubaCyprusCzech RepublicDenmarkDjiboutiDominicaDominican RepublicEarly-demographic dividendEast Asia & PacificEast Asia & Pacific (excluding high income)East Asia & Pacific (IDA & IBRD countries)EcuadorEgypt, Arab Rep.El SalvadorEquatorial GuineaEritreaEstoniaEthiopiaEuro areaEurope & Central AsiaEurope & Central Asia (excluding high income)Europe & Central Asia (IDA & IBRD countries)European UnionFaroe IslandsFijiFinlandFragile and conflict affected situationsFranceFrench PolynesiaGabonGambia, TheGeorgiaGermanyGhanaGreeceGrenadaGuatemalaGuineaGuinea-BissauGuyanaHaitiHeavily indebted poor countries (HIPC)High incomeHondurasHong Kong SAR, ChinaHungaryIBRD onlyIcelandIDA & IBRD totalIDA blendIDA onlyIDA totalIndiaIndonesiaIran, Islamic Rep.IraqIrelandIsraelItalyJamaicaJapanJordanKazakhstanKenyaKiribatiKorea, Rep.KosovoKuwaitKyrgyz RepublicLao PDRLate-demographic dividendLatin America & Caribbean Latin America & Caribbean (excluding high income)Latin America & the Caribbean (IDA & IBRD countries)LatviaLeast developed countries: UN classificationLebanonLesothoLiberiaLibyaLithuaniaLow & middle incomeLow incomeLower middle incomeLuxembourgMacao SAR, ChinaMacedonia, FYRMadagascarMalawiMalaysiaMaldivesMaliMaltaMauritaniaMauritiusMexicoMicronesia, Fed. Sts.Middle East & North AfricaMiddle East & North Africa (excluding high income)Middle East & North Africa (IDA & IBRD countries)Middle incomeMoldovaMongoliaMontenegroMoroccoMozambiqueNamibiaNepalNetherlandsNew CaledoniaNew ZealandNicaraguaNigerNigeriaNorth AmericaNorwayOECD membersOmanOther small statesPacific island small statesPakistanPanamaPapua New GuineaParaguayPeruPhilippinesPolandPortugalPost-demographic dividendPre-demographic dividendPuerto RicoQatarRomaniaRussian FederationRwandaSaudi ArabiaSenegalSerbiaSeychellesSierra LeoneSingaporeSlovak RepublicSloveniaSmall statesSolomon IslandsSomaliaSouth AfricaSouth AsiaSouth Asia (IDA & IBRD)South SudanSpainSri LankaSt. Kitts and NevisSt. LuciaSt. Vincent and the GrenadinesSub-Saharan Africa Sub-Saharan Africa (excluding high income)Sub-Saharan Africa (IDA & IBRD countries)SudanSurinameSwazilandSwedenSwitzerlandSyrian Arab RepublicTajikistanTanzaniaThailandTimor-LesteTogoTongaTrinidad and TobagoTunisiaTurkeyTurkmenistanUgandaUkraineUnited Arab EmiratesUnited KingdomUnited StatesUpper middle incomeUruguayUzbekistanVanuatuVenezuela, RBVietnamWest Bank and GazaWorldYemen, Rep.ZambiaZimbabwe Timeline:
This timeline shows a graph from 1971 to 2016 of Guinea-Bissau. No data until 1970. Number of actual observations by date: 46.
Source name:
World Development Indicators
Source organization:
World Bank national accounts data, and OECD National Accounts data files.
Categories, topics:
Economy & Growth
Last updated:
apr 23, 2017
Indicators value changes by year
Maximum:
29.438
jan 1, 1983
At the date of observation
Value
Absolute change
Change from previous value
jan 1, 1971
19.939
+19.939
0.0%
jan 1, 1972
21.656
+1.717
8.61%
jan 1, 1973
22.782
+1.126
5.2%
jan 1, 1974
24.467
+1.685
7.4%
jan 1, 1975
25.236
+0.769
3.14%
jan 1, 1976
22.893
-2.342
-9.28%
jan 1, 1977
24.905
+2.011
8.79%
jan 1, 1978
18.535
-6.37
-25.58%
jan 1, 1979
21.126
+2.591
13.98%
jan 1, 1980
22.243
+1.117
5.29%
jan 1, 1981
27.641
+5.398
24.27%
jan 1, 1982
28.487
+0.847
3.06%
jan 1, 1983
29.438
+0.951
3.34%
jan 1, 1984
25.453
-3.985
-13.54%
jan 1, 1985
15.431
-10.022
-39.37%
jan 1, 1986
17.93
+2.499
16.19%
jan 1, 1987
13.243
-4.687
-26.14%
jan 1, 1988
10.698
-2.545
-19.22%
jan 1, 1989
9.638
-1.06
-9.91%
jan 1, 1990
11.229
+1.591
16.51%
jan 1, 1991
10.291
-0.937
-8.35%
jan 1, 1992
10.617
+0.326
3.17%
jan 1, 1993
8.978
-1.639
-15.44%
jan 1, 1994
7.053
-1.925
-21.45%
jan 1, 1995
7.124
+0.071
1.01%
jan 1, 1996
6.408
-0.716
-10.05%
jan 1, 1997
6.559
+0.151
2.36%
jan 1, 1998
7.018
+0.459
7.0%
jan 1, 1999
9.278
+2.26
32.2%
jan 1, 2000
10.782
+1.505
16.22%
jan 1, 2001
18.572
+7.79
72.25%
jan 1, 2002
14.629
-3.943
-21.23%
jan 1, 2003
14.38
-0.249
-1.7%
jan 1, 2004
16.487
+2.106
14.65%
jan 1, 2005
14.181
-2.305
-13.98%
jan 1, 2006
14.613
+0.432
3.04%
jan 1, 2007
14.577
-0.036
-0.25%
jan 1, 2008
15.122
+0.546
3.74%
jan 1, 2009
11.884
-3.239
-21.42%
jan 1, 2010
15.48
+3.597
30.27%
jan 1, 2011
15.219
-0.261
-1.69%
jan 1, 2012
13.08
-2.139
-14.05%
jan 1, 2013
12.433
-0.648
-4.95%
jan 1, 2014
11.695
-0.737
-5.93%
jan 1, 2015
13.019
+1.324
11.32%
jan 1, 2016
10.887
-2.133
-16.38%
Ranking of countries by current statistics by years


Comments: