29
/
en
AIzaSyAYiBZKx7MnpbEhh9jyipgxe19OcubqV5w
April 1, 2024
43435
Latin America & the Caribbean (IDA & IBRD countries)
TLA
false
2
1
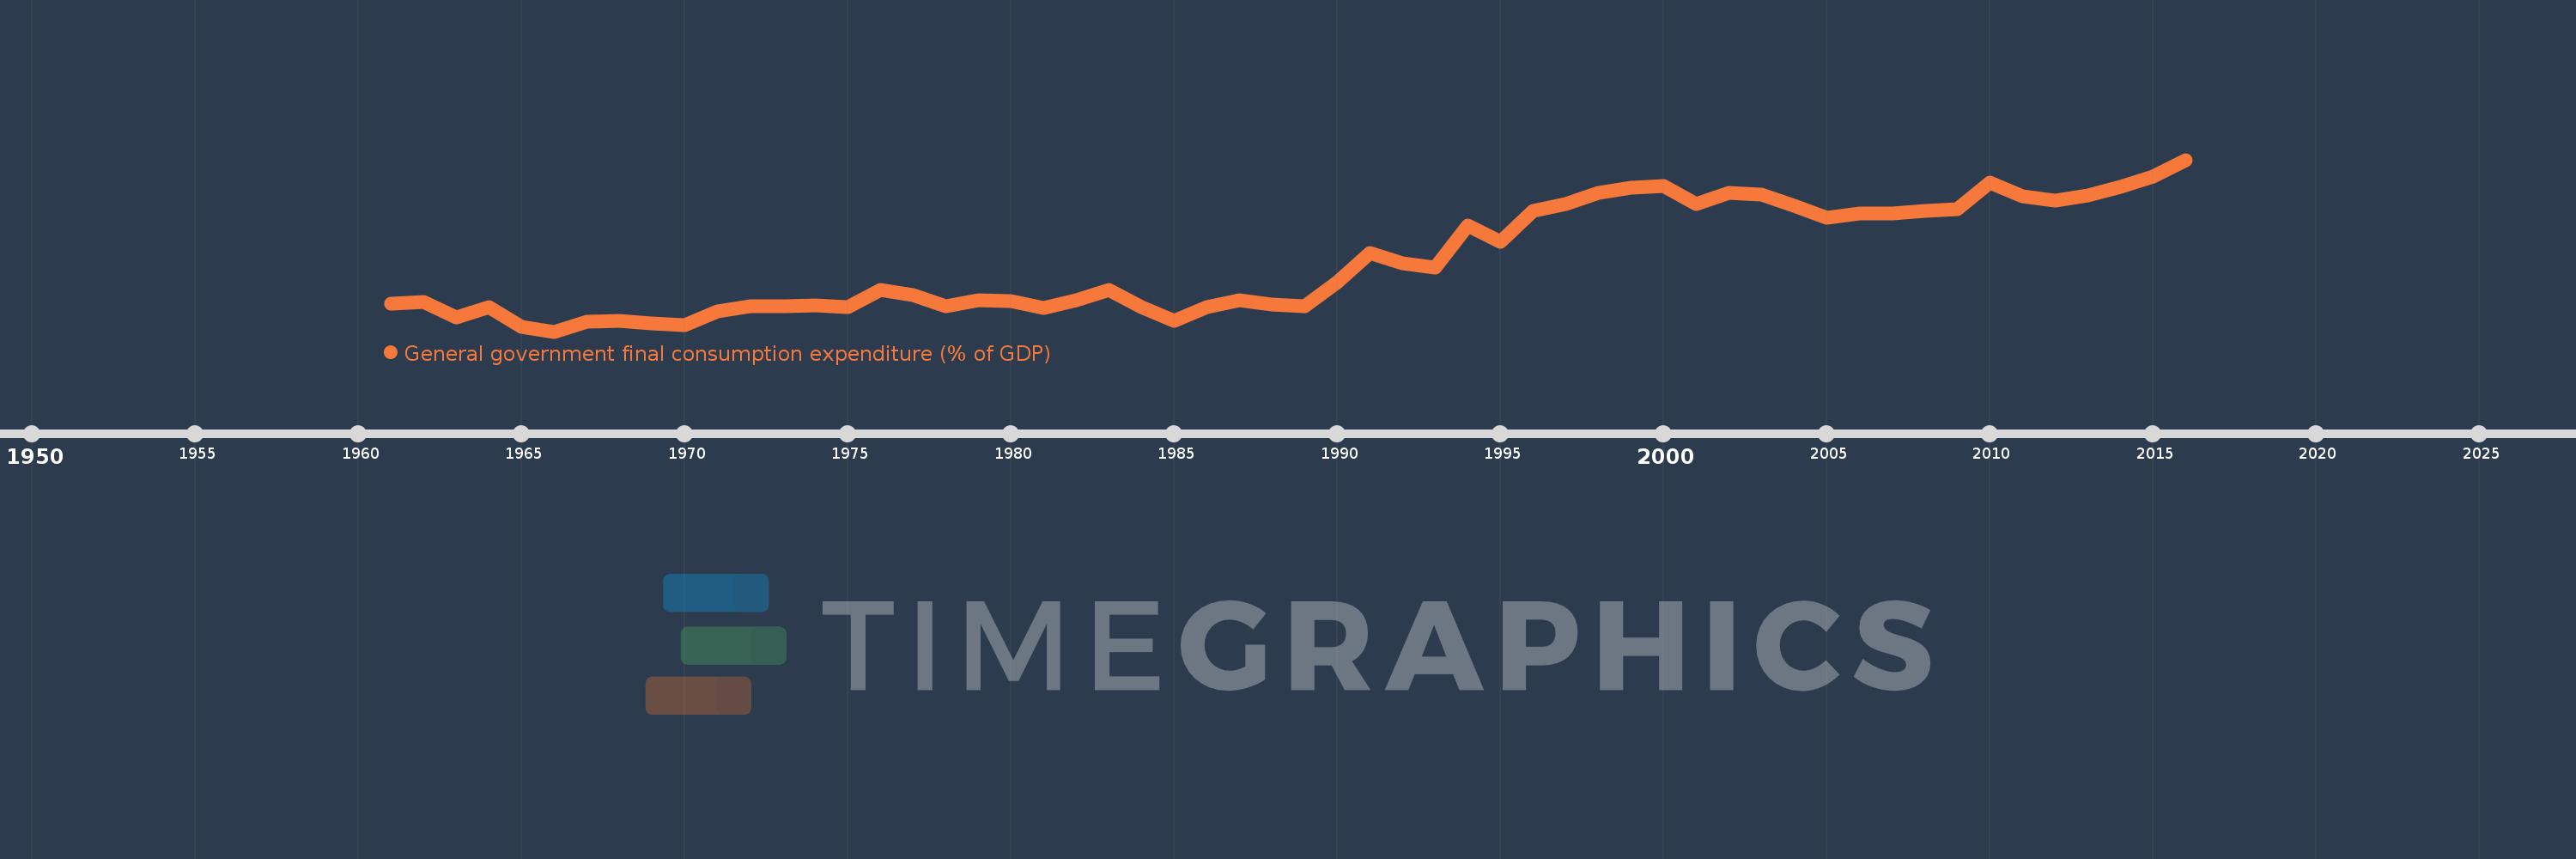
General government final consumption expenditure (% of GDP)
2016,2015,2014,2013,2012,2011,2010,2009,2008,2007,2006,2005,2004,2003,2002,2001,2000,1999,1998,1997,1996,1995,1994,1993,1992,1991,1990,1989,1988,1987,1986,1985,1984,1983,1982,1981,1980,1979,1978,1977,1976,1975,1974,1973,1972,1971,1970,1969,1968,1967,1966,1965,1964,1963,1962,1961
This statistics in other country:
AfghanistanAlbaniaAlgeriaAngolaAntigua and BarbudaArab WorldArgentinaArmeniaArubaAustraliaAustriaAzerbaijanBahamas, TheBahrainBangladeshBarbadosBelarusBelgiumBelizeBeninBermudaBhutanBoliviaBosnia and HerzegovinaBotswanaBrazilBrunei DarussalamBulgariaBurkina FasoBurundiCabo VerdeCambodiaCameroonCanadaCaribbean small statesCentral African RepublicCentral Europe and the BalticsChadChileChinaColombiaComorosCongo, Dem. Rep.Congo, Rep.Costa RicaCote d'IvoireCroatiaCubaCyprusCzech RepublicDenmarkDjiboutiDominicaDominican RepublicEarly-demographic dividendEast Asia & PacificEast Asia & Pacific (excluding high income)East Asia & Pacific (IDA & IBRD countries)EcuadorEgypt, Arab Rep.El SalvadorEquatorial GuineaEritreaEstoniaEthiopiaEuro areaEurope & Central AsiaEurope & Central Asia (excluding high income)Europe & Central Asia (IDA & IBRD countries)European UnionFaroe IslandsFijiFinlandFragile and conflict affected situationsFranceFrench PolynesiaGabonGambia, TheGeorgiaGermanyGhanaGreeceGrenadaGuatemalaGuineaGuinea-BissauGuyanaHaitiHeavily indebted poor countries (HIPC)High incomeHondurasHong Kong SAR, ChinaHungaryIBRD onlyIcelandIDA & IBRD totalIDA blendIDA onlyIDA totalIndiaIndonesiaIran, Islamic Rep.IraqIrelandIsraelItalyJamaicaJapanJordanKazakhstanKenyaKiribatiKorea, Rep.KosovoKuwaitKyrgyz RepublicLao PDRLate-demographic dividendLatin America & Caribbean Latin America & Caribbean (excluding high income)Latin America & the Caribbean (IDA & IBRD countries)LatviaLeast developed countries: UN classificationLebanonLesothoLiberiaLibyaLithuaniaLow & middle incomeLow incomeLower middle incomeLuxembourgMacao SAR, ChinaMacedonia, FYRMadagascarMalawiMalaysiaMaldivesMaliMaltaMauritaniaMauritiusMexicoMicronesia, Fed. Sts.Middle East & North AfricaMiddle East & North Africa (excluding high income)Middle East & North Africa (IDA & IBRD countries)Middle incomeMoldovaMongoliaMontenegroMoroccoMozambiqueNamibiaNepalNetherlandsNew CaledoniaNew ZealandNicaraguaNigerNigeriaNorth AmericaNorwayOECD membersOmanOther small statesPacific island small statesPakistanPanamaPapua New GuineaParaguayPeruPhilippinesPolandPortugalPost-demographic dividendPre-demographic dividendPuerto RicoQatarRomaniaRussian FederationRwandaSaudi ArabiaSenegalSerbiaSeychellesSierra LeoneSingaporeSlovak RepublicSloveniaSmall statesSolomon IslandsSomaliaSouth AfricaSouth AsiaSouth Asia (IDA & IBRD)South SudanSpainSri LankaSt. Kitts and NevisSt. LuciaSt. Vincent and the GrenadinesSub-Saharan Africa Sub-Saharan Africa (excluding high income)Sub-Saharan Africa (IDA & IBRD countries)SudanSurinameSwazilandSwedenSwitzerlandSyrian Arab RepublicTajikistanTanzaniaThailandTimor-LesteTogoTongaTrinidad and TobagoTunisiaTurkeyTurkmenistanUgandaUkraineUnited Arab EmiratesUnited KingdomUnited StatesUpper middle incomeUruguayUzbekistanVanuatuVenezuela, RBVietnamWest Bank and GazaWorldYemen, Rep.ZambiaZimbabwe Timeline:
This timeline shows a graph from 1961 to 2016 of Latin America & the Caribbean (IDA & IBRD countries). No data until 1960. Number of actual observations by date: 56.
Source name:
World Development Indicators
Source organization:
World Bank national accounts data, and OECD National Accounts data files.
Categories, topics:
Economy & Growth
Last updated:
apr 23, 2017
Indicators value changes by year
Maximum:
16.953
jan 1, 2016
At the date of observation
Value
Absolute change
Change from previous value
jan 1, 1961
10.555
+10.555
0.0%
jan 1, 1962
10.61
+0.055
0.52%
jan 1, 1963
9.933
-0.677
-6.38%
jan 1, 1964
10.378
+0.444
4.47%
jan 1, 1965
9.525
-0.852
-8.21%
jan 1, 1966
9.303
-0.222
-2.33%
jan 1, 1967
9.739
+0.435
4.68%
jan 1, 1968
9.8
+0.061
0.63%
jan 1, 1969
9.679
-0.121
-1.24%
jan 1, 1970
9.592
-0.087
-0.89%
jan 1, 1971
10.201
+0.609
6.35%
jan 1, 1972
10.438
+0.237
2.32%
jan 1, 1973
10.447
+0.009
0.09%
jan 1, 1974
10.452
+0.005
0.05%
jan 1, 1975
10.378
-0.073
-0.7%
jan 1, 1976
11.157
+0.778
7.5%
jan 1, 1977
10.92
-0.237
-2.13%
jan 1, 1978
10.416
-0.504
-4.61%
jan 1, 1979
10.69
+0.274
2.63%
jan 1, 1980
10.68
-0.009
-0.09%
jan 1, 1981
10.35
-0.33
-3.09%
jan 1, 1982
10.699
+0.349
3.37%
jan 1, 1983
11.158
+0.459
4.29%
jan 1, 1984
10.401
-0.757
-6.79%
jan 1, 1985
9.786
-0.615
-5.91%
jan 1, 1986
10.398
+0.612
6.26%
jan 1, 1987
10.709
+0.311
2.99%
jan 1, 1988
10.49
-0.219
-2.04%
jan 1, 1989
10.417
-0.073
-0.7%
jan 1, 1990
11.484
+1.067
10.24%
jan 1, 1991
12.79
+1.307
11.38%
jan 1, 1992
12.355
-0.436
-3.41%
jan 1, 1993
12.144
-0.211
-1.71%
jan 1, 1994
14.042
+1.898
15.63%
jan 1, 1995
13.314
-0.727
-5.18%
jan 1, 1996
14.676
+1.362
10.23%
jan 1, 1997
14.973
+0.297
2.02%
jan 1, 1998
15.491
+0.518
3.46%
jan 1, 1999
15.714
+0.223
1.44%
jan 1, 2000
15.773
+0.059
0.38%
jan 1, 2001
14.968
-0.805
-5.1%
jan 1, 2002
15.469
+0.501
3.35%
jan 1, 2003
15.388
-0.081
-0.53%
jan 1, 2004
14.908
-0.48
-3.12%
jan 1, 2005
14.356
-0.552
-3.7%
jan 1, 2006
14.551
+0.195
1.36%
jan 1, 2007
14.574
+0.023
0.16%
jan 1, 2008
14.661
+0.087
0.59%
jan 1, 2009
14.764
+0.104
0.71%
jan 1, 2010
15.947
+1.182
8.01%
jan 1, 2011
15.32
-0.627
-3.93%
jan 1, 2012
15.149
-0.171
-1.11%
jan 1, 2013
15.373
+0.224
1.48%
jan 1, 2014
15.746
+0.373
2.42%
jan 1, 2015
16.215
+0.47
2.98%
jan 1, 2016
16.953
+0.738
4.55%
Ranking of countries by current statistics by years


Comments: