29
/
en
AIzaSyAYiBZKx7MnpbEhh9jyipgxe19OcubqV5w
April 1, 2024
206759
Nepal
NPL
true
2
1
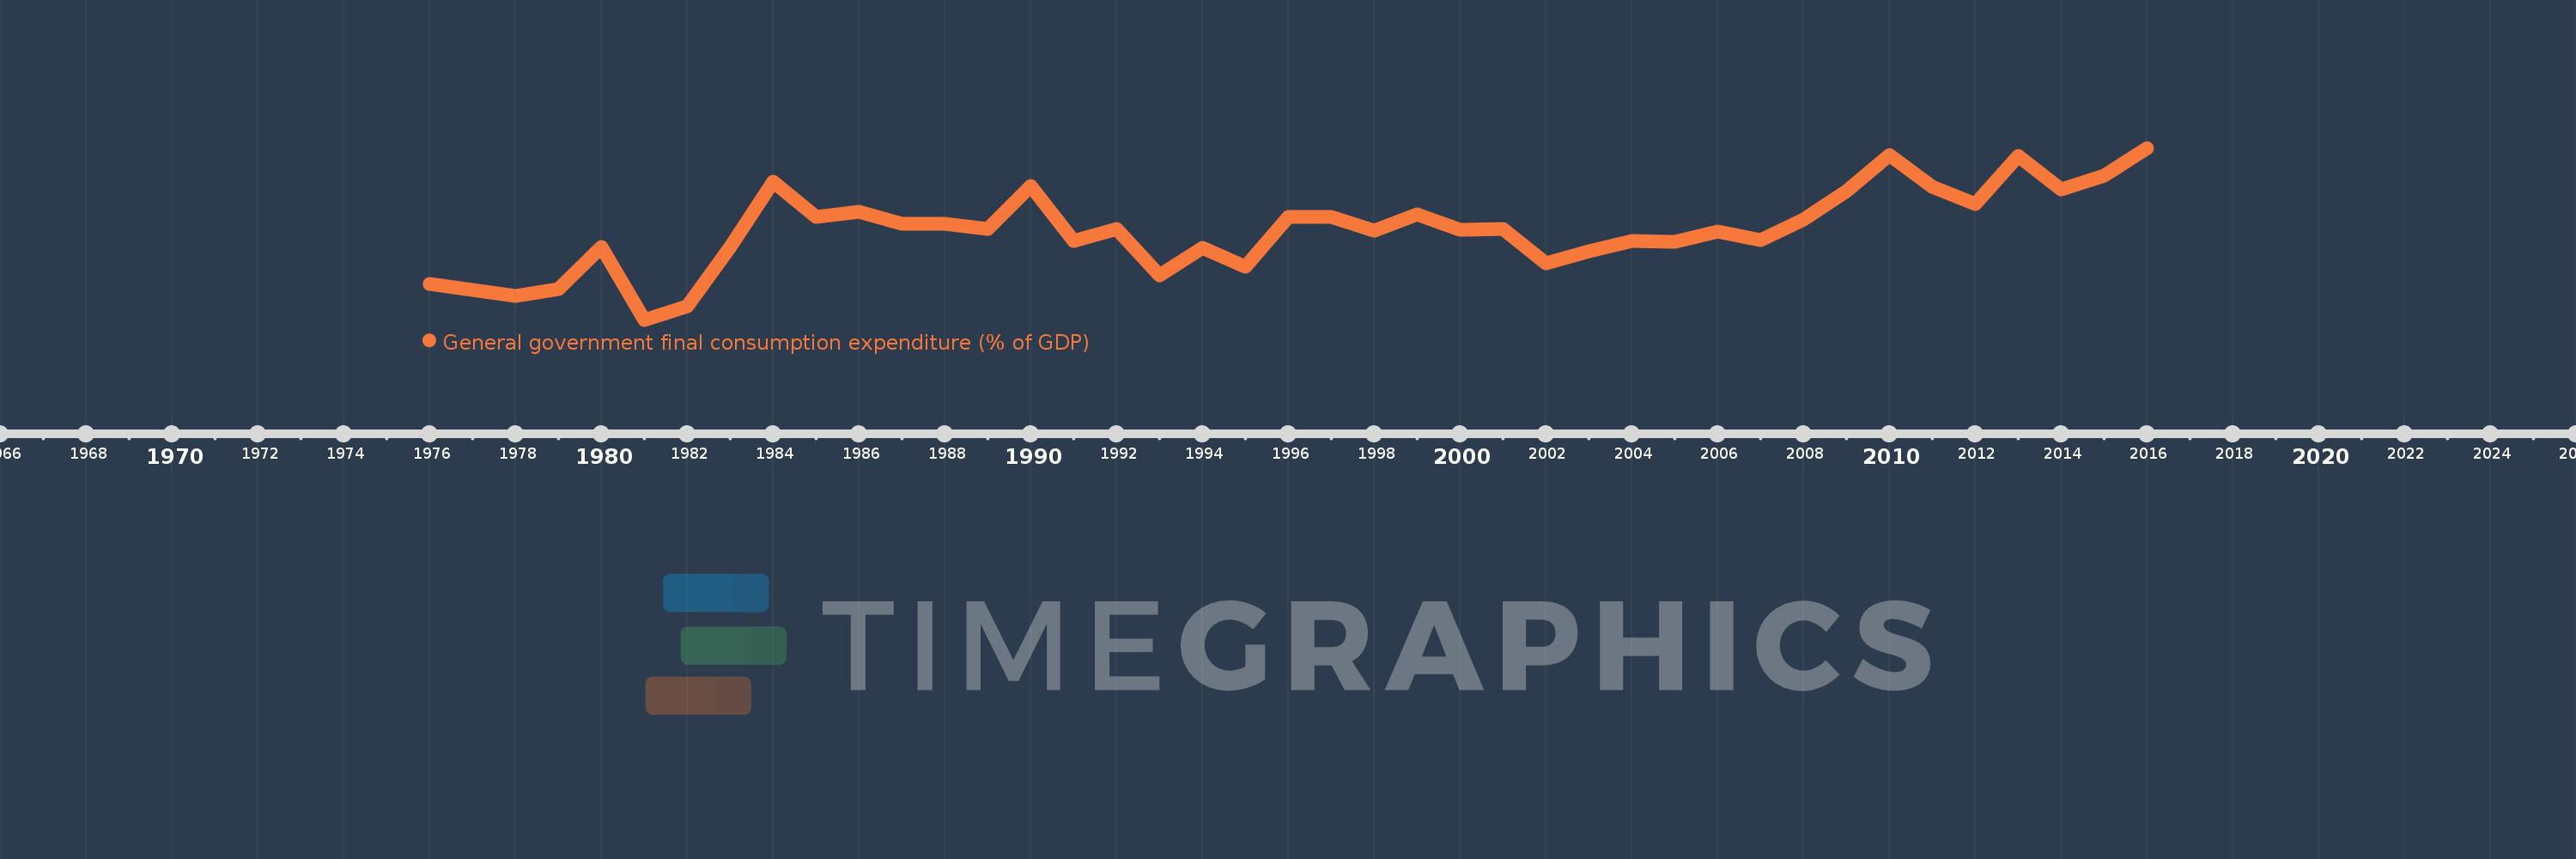
General government final consumption expenditure (% of GDP)
2016,2015,2014,2013,2012,2011,2010,2009,2008,2007,2006,2005,2004,2003,2002,2001,2000,1999,1998,1997,1996,1995,1994,1993,1992,1991,1990,1989,1988,1987,1986,1985,1984,1983,1982,1981,1980,1979,1978,1977,1976
This statistics in other country:
AfghanistanAlbaniaAlgeriaAngolaAntigua and BarbudaArab WorldArgentinaArmeniaArubaAustraliaAustriaAzerbaijanBahamas, TheBahrainBangladeshBarbadosBelarusBelgiumBelizeBeninBermudaBhutanBoliviaBosnia and HerzegovinaBotswanaBrazilBrunei DarussalamBulgariaBurkina FasoBurundiCabo VerdeCambodiaCameroonCanadaCaribbean small statesCentral African RepublicCentral Europe and the BalticsChadChileChinaColombiaComorosCongo, Dem. Rep.Congo, Rep.Costa RicaCote d'IvoireCroatiaCubaCyprusCzech RepublicDenmarkDjiboutiDominicaDominican RepublicEarly-demographic dividendEast Asia & PacificEast Asia & Pacific (excluding high income)East Asia & Pacific (IDA & IBRD countries)EcuadorEgypt, Arab Rep.El SalvadorEquatorial GuineaEritreaEstoniaEthiopiaEuro areaEurope & Central AsiaEurope & Central Asia (excluding high income)Europe & Central Asia (IDA & IBRD countries)European UnionFaroe IslandsFijiFinlandFragile and conflict affected situationsFranceFrench PolynesiaGabonGambia, TheGeorgiaGermanyGhanaGreeceGrenadaGuatemalaGuineaGuinea-BissauGuyanaHaitiHeavily indebted poor countries (HIPC)High incomeHondurasHong Kong SAR, ChinaHungaryIBRD onlyIcelandIDA & IBRD totalIDA blendIDA onlyIDA totalIndiaIndonesiaIran, Islamic Rep.IraqIrelandIsraelItalyJamaicaJapanJordanKazakhstanKenyaKiribatiKorea, Rep.KosovoKuwaitKyrgyz RepublicLao PDRLate-demographic dividendLatin America & Caribbean Latin America & Caribbean (excluding high income)Latin America & the Caribbean (IDA & IBRD countries)LatviaLeast developed countries: UN classificationLebanonLesothoLiberiaLibyaLithuaniaLow & middle incomeLow incomeLower middle incomeLuxembourgMacao SAR, ChinaMacedonia, FYRMadagascarMalawiMalaysiaMaldivesMaliMaltaMauritaniaMauritiusMexicoMicronesia, Fed. Sts.Middle East & North AfricaMiddle East & North Africa (excluding high income)Middle East & North Africa (IDA & IBRD countries)Middle incomeMoldovaMongoliaMontenegroMoroccoMozambiqueNamibiaNepalNetherlandsNew CaledoniaNew ZealandNicaraguaNigerNigeriaNorth AmericaNorwayOECD membersOmanOther small statesPacific island small statesPakistanPanamaPapua New GuineaParaguayPeruPhilippinesPolandPortugalPost-demographic dividendPre-demographic dividendPuerto RicoQatarRomaniaRussian FederationRwandaSaudi ArabiaSenegalSerbiaSeychellesSierra LeoneSingaporeSlovak RepublicSloveniaSmall statesSolomon IslandsSomaliaSouth AfricaSouth AsiaSouth Asia (IDA & IBRD)South SudanSpainSri LankaSt. Kitts and NevisSt. LuciaSt. Vincent and the GrenadinesSub-Saharan Africa Sub-Saharan Africa (excluding high income)Sub-Saharan Africa (IDA & IBRD countries)SudanSurinameSwazilandSwedenSwitzerlandSyrian Arab RepublicTajikistanTanzaniaThailandTimor-LesteTogoTongaTrinidad and TobagoTunisiaTurkeyTurkmenistanUgandaUkraineUnited Arab EmiratesUnited KingdomUnited StatesUpper middle incomeUruguayUzbekistanVanuatuVenezuela, RBVietnamWest Bank and GazaWorldYemen, Rep.ZambiaZimbabwe Timeline:
This timeline shows a graph from 1976 to 2016 of Nepal. No data until 1975. Number of actual observations by date: 41.
Source name:
World Development Indicators
Source organization:
World Bank national accounts data, and OECD National Accounts data files.
Categories, topics:
Economy & Growth
Last updated:
apr 23, 2017
Indicators value changes by year
Maximum:
10.966
jan 1, 2016
At the date of observation
Value
Absolute change
Change from previous value
jan 1, 1976
7.586
+7.586
0.0%
jan 1, 1977
7.439
-0.146
-1.93%
jan 1, 1978
7.292
-0.148
-1.99%
jan 1, 1979
7.455
+0.163
2.24%
jan 1, 1980
8.503
+1.048
14.06%
jan 1, 1981
6.702
-1.801
-21.18%
jan 1, 1982
7.038
+0.336
5.02%
jan 1, 1983
8.513
+1.474
20.95%
jan 1, 1984
10.118
+1.606
18.86%
jan 1, 1985
9.251
-0.867
-8.57%
jan 1, 1986
9.383
+0.132
1.42%
jan 1, 1987
9.089
-0.293
-3.12%
jan 1, 1988
9.077
-0.012
-0.14%
jan 1, 1989
8.965
-0.112
-1.23%
jan 1, 1990
10.023
+1.057
11.79%
jan 1, 1991
8.663
-1.359
-13.56%
jan 1, 1992
8.954
+0.291
3.36%
jan 1, 1993
7.798
-1.156
-12.91%
jan 1, 1994
8.481
+0.684
8.77%
jan 1, 1995
8.023
-0.459
-5.41%
jan 1, 1996
9.247
+1.224
15.26%
jan 1, 1997
9.247
+0.0
0.0%
jan 1, 1998
8.908
-0.34
-3.67%
jan 1, 1999
9.312
+0.404
4.54%
jan 1, 2000
8.926
-0.386
-4.15%
jan 1, 2001
8.95
+0.024
0.27%
jan 1, 2002
8.105
-0.845
-9.44%
jan 1, 2003
8.398
+0.293
3.62%
jan 1, 2004
8.665
+0.267
3.17%
jan 1, 2005
8.644
-0.021
-0.24%
jan 1, 2006
8.899
+0.255
2.95%
jan 1, 2007
8.683
-0.216
-2.43%
jan 1, 2008
9.198
+0.515
5.94%
jan 1, 2009
9.889
+0.691
7.51%
jan 1, 2010
10.779
+0.89
9.0%
jan 1, 2011
9.993
-0.787
-7.3%
jan 1, 2012
9.577
-0.415
-4.16%
jan 1, 2013
10.762
+1.185
12.37%
jan 1, 2014
9.935
-0.826
-7.68%
jan 1, 2015
10.278
+0.343
3.45%
jan 1, 2016
10.966
+0.688
6.69%
Ranking of countries by current statistics by years


Comments: