29
/
en
AIzaSyAYiBZKx7MnpbEhh9jyipgxe19OcubqV5w
April 1, 2024
150382
Honduras
HND
true
2
1
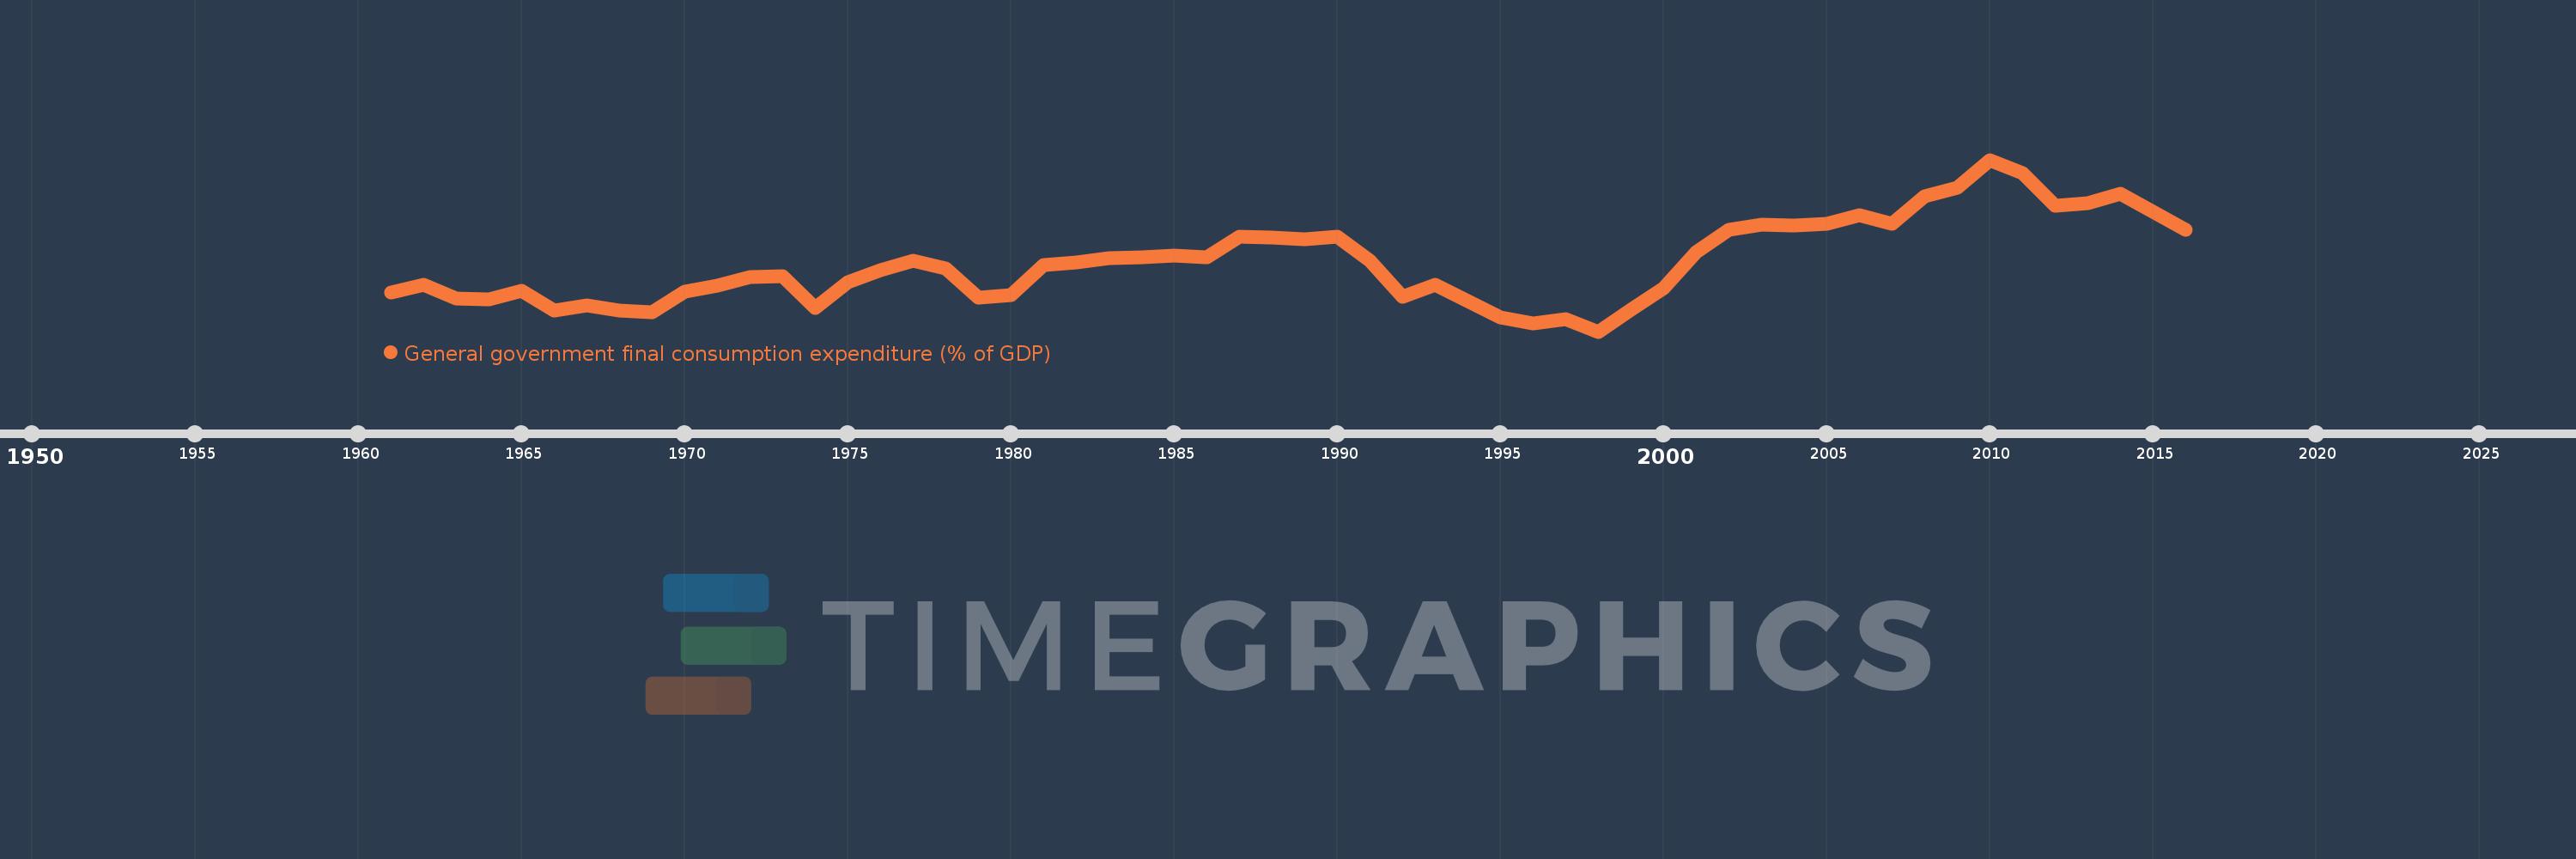
General government final consumption expenditure (% of GDP)
2016,2015,2014,2013,2012,2011,2010,2009,2008,2007,2006,2005,2004,2003,2002,2001,2000,1999,1998,1997,1996,1995,1994,1993,1992,1991,1990,1989,1988,1987,1986,1985,1984,1983,1982,1981,1980,1979,1978,1977,1976,1975,1974,1973,1972,1971,1970,1969,1968,1967,1966,1965,1964,1963,1962,1961
This statistics in other country:
AfghanistanAlbaniaAlgeriaAngolaAntigua and BarbudaArab WorldArgentinaArmeniaArubaAustraliaAustriaAzerbaijanBahamas, TheBahrainBangladeshBarbadosBelarusBelgiumBelizeBeninBermudaBhutanBoliviaBosnia and HerzegovinaBotswanaBrazilBrunei DarussalamBulgariaBurkina FasoBurundiCabo VerdeCambodiaCameroonCanadaCaribbean small statesCentral African RepublicCentral Europe and the BalticsChadChileChinaColombiaComorosCongo, Dem. Rep.Congo, Rep.Costa RicaCote d'IvoireCroatiaCubaCyprusCzech RepublicDenmarkDjiboutiDominicaDominican RepublicEarly-demographic dividendEast Asia & PacificEast Asia & Pacific (excluding high income)East Asia & Pacific (IDA & IBRD countries)EcuadorEgypt, Arab Rep.El SalvadorEquatorial GuineaEritreaEstoniaEthiopiaEuro areaEurope & Central AsiaEurope & Central Asia (excluding high income)Europe & Central Asia (IDA & IBRD countries)European UnionFaroe IslandsFijiFinlandFragile and conflict affected situationsFranceFrench PolynesiaGabonGambia, TheGeorgiaGermanyGhanaGreeceGrenadaGuatemalaGuineaGuinea-BissauGuyanaHaitiHeavily indebted poor countries (HIPC)High incomeHondurasHong Kong SAR, ChinaHungaryIBRD onlyIcelandIDA & IBRD totalIDA blendIDA onlyIDA totalIndiaIndonesiaIran, Islamic Rep.IraqIrelandIsraelItalyJamaicaJapanJordanKazakhstanKenyaKiribatiKorea, Rep.KosovoKuwaitKyrgyz RepublicLao PDRLate-demographic dividendLatin America & Caribbean Latin America & Caribbean (excluding high income)Latin America & the Caribbean (IDA & IBRD countries)LatviaLeast developed countries: UN classificationLebanonLesothoLiberiaLibyaLithuaniaLow & middle incomeLow incomeLower middle incomeLuxembourgMacao SAR, ChinaMacedonia, FYRMadagascarMalawiMalaysiaMaldivesMaliMaltaMauritaniaMauritiusMexicoMicronesia, Fed. Sts.Middle East & North AfricaMiddle East & North Africa (excluding high income)Middle East & North Africa (IDA & IBRD countries)Middle incomeMoldovaMongoliaMontenegroMoroccoMozambiqueNamibiaNepalNetherlandsNew CaledoniaNew ZealandNicaraguaNigerNigeriaNorth AmericaNorwayOECD membersOmanOther small statesPacific island small statesPakistanPanamaPapua New GuineaParaguayPeruPhilippinesPolandPortugalPost-demographic dividendPre-demographic dividendPuerto RicoQatarRomaniaRussian FederationRwandaSaudi ArabiaSenegalSerbiaSeychellesSierra LeoneSingaporeSlovak RepublicSloveniaSmall statesSolomon IslandsSomaliaSouth AfricaSouth AsiaSouth Asia (IDA & IBRD)South SudanSpainSri LankaSt. Kitts and NevisSt. LuciaSt. Vincent and the GrenadinesSub-Saharan Africa Sub-Saharan Africa (excluding high income)Sub-Saharan Africa (IDA & IBRD countries)SudanSurinameSwazilandSwedenSwitzerlandSyrian Arab RepublicTajikistanTanzaniaThailandTimor-LesteTogoTongaTrinidad and TobagoTunisiaTurkeyTurkmenistanUgandaUkraineUnited Arab EmiratesUnited KingdomUnited StatesUpper middle incomeUruguayUzbekistanVanuatuVenezuela, RBVietnamWest Bank and GazaWorldYemen, Rep.ZambiaZimbabwe Timeline:
This timeline shows a graph from 1961 to 2016 of Honduras. No data until 1960. Number of actual observations by date: 56.
Source name:
World Development Indicators
Source organization:
World Bank national accounts data, and OECD National Accounts data files.
Categories, topics:
Economy & Growth
Last updated:
apr 23, 2017
Indicators value changes by year
At the date of observation
Value
Absolute change
Change from previous value
jan 1, 1961
11.068
+11.068
0.0%
jan 1, 1962
11.524
+0.456
4.12%
jan 1, 1963
10.741
-0.783
-6.79%
jan 1, 1964
10.702
-0.039
-0.37%
jan 1, 1965
11.171
+0.469
4.38%
jan 1, 1966
10.046
-1.124
-10.07%
jan 1, 1967
10.355
+0.309
3.08%
jan 1, 1968
10.048
-0.307
-2.96%
jan 1, 1969
9.957
-0.092
-0.91%
jan 1, 1970
11.115
+1.159
11.64%
jan 1, 1971
11.48
+0.365
3.28%
jan 1, 1972
11.97
+0.49
4.27%
jan 1, 1973
12.017
+0.048
0.4%
jan 1, 1974
10.192
-1.826
-15.19%
jan 1, 1975
11.696
+1.505
14.76%
jan 1, 1976
12.367
+0.67
5.73%
jan 1, 1977
12.908
+0.541
4.38%
jan 1, 1978
12.489
-0.419
-3.25%
jan 1, 1979
10.806
-1.683
-13.47%
jan 1, 1980
10.948
+0.142
1.32%
jan 1, 1981
12.666
+1.717
15.69%
jan 1, 1982
12.786
+0.12
0.95%
jan 1, 1983
13.053
+0.267
2.09%
jan 1, 1984
13.113
+0.06
0.46%
jan 1, 1985
13.197
+0.083
0.64%
jan 1, 1986
13.092
-0.104
-0.79%
jan 1, 1987
14.271
+1.178
9.0%
jan 1, 1988
14.22
-0.05
-0.35%
jan 1, 1989
14.139
-0.081
-0.57%
jan 1, 1990
14.273
+0.134
0.95%
jan 1, 1991
12.93
-1.344
-9.41%
jan 1, 1992
10.843
-2.086
-16.14%
jan 1, 1993
11.548
+0.704
6.5%
jan 1, 1994
10.6
-0.948
-8.21%
jan 1, 1995
9.632
-0.968
-9.13%
jan 1, 1996
9.318
-0.314
-3.26%
jan 1, 1997
9.539
+0.221
2.37%
jan 1, 1998
8.842
-0.697
-7.3%
jan 1, 1999
10.104
+1.262
14.27%
jan 1, 2000
11.318
+1.214
12.02%
jan 1, 2001
13.408
+2.09
18.47%
jan 1, 2002
14.687
+1.279
9.54%
jan 1, 2003
14.976
+0.288
1.96%
jan 1, 2004
14.921
-0.055
-0.37%
jan 1, 2005
15.011
+0.09
0.6%
jan 1, 2006
15.523
+0.512
3.41%
jan 1, 2007
15.004
-0.519
-3.34%
jan 1, 2008
16.602
+1.599
10.65%
jan 1, 2009
17.115
+0.512
3.09%
jan 1, 2010
18.7
+1.585
9.26%
jan 1, 2011
17.926
-0.773
-4.14%
jan 1, 2012
16.064
-1.862
-10.39%
jan 1, 2013
16.202
+0.137
0.86%
jan 1, 2014
16.734
+0.532
3.28%
jan 1, 2015
15.71
-1.024
-6.12%
jan 1, 2016
14.704
-1.006
-6.4%
Ranking of countries by current statistics by years


Comments: