29
/
en
AIzaSyAYiBZKx7MnpbEhh9jyipgxe19OcubqV5w
April 1, 2024
259588
Tajikistan
TJK
true
2
1
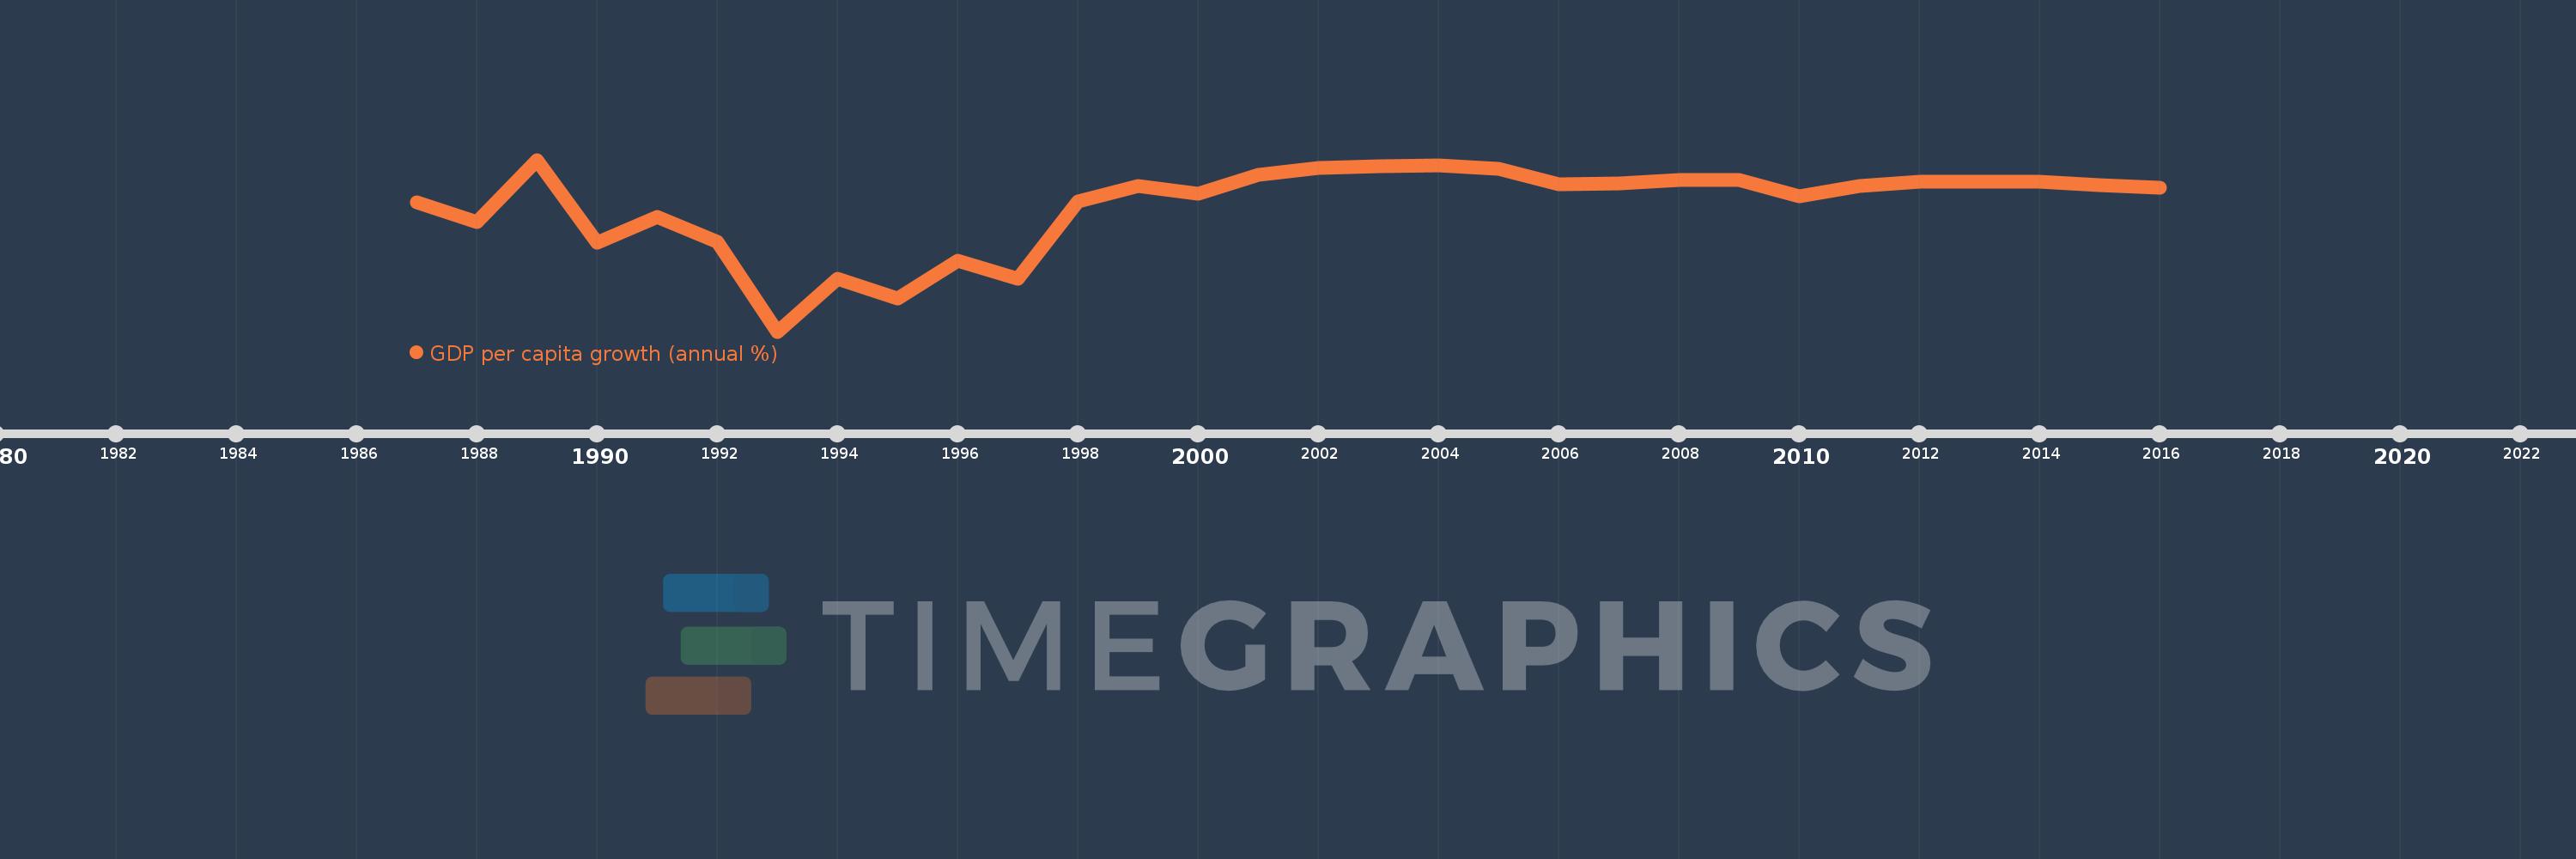
GDP per capita growth (annual %)
2016,2015,2014,2013,2012,2011,2010,2009,2008,2007,2006,2005,2004,2003,2002,2001,2000,1999,1998,1997,1996,1995,1994,1993,1992,1991,1990,1989,1988,1987
This statistics in other country:
AfghanistanAlbaniaAlgeriaAndorraAngolaAntigua and BarbudaArab WorldArgentinaArmeniaArubaAustraliaAustriaAzerbaijanBahamas, TheBahrainBangladeshBarbadosBelarusBelgiumBelizeBeninBermudaBhutanBoliviaBosnia and HerzegovinaBotswanaBrazilBrunei DarussalamBulgariaBurkina FasoBurundiCabo VerdeCambodiaCameroonCanadaCaribbean small statesCayman IslandsCentral African RepublicCentral Europe and the BalticsChadChannel IslandsChileChinaColombiaComorosCongo, Dem. Rep.Congo, Rep.Costa RicaCote d'IvoireCroatiaCubaCyprusCzech RepublicDenmarkDjiboutiDominicaDominican RepublicEarly-demographic dividendEast Asia & PacificEast Asia & Pacific (excluding high income)East Asia & Pacific (IDA & IBRD countries)EcuadorEgypt, Arab Rep.El SalvadorEquatorial GuineaEritreaEstoniaEthiopiaEuro areaEurope & Central AsiaEurope & Central Asia (excluding high income)Europe & Central Asia (IDA & IBRD countries)European UnionFijiFinlandFragile and conflict affected situationsFranceFrench PolynesiaGabonGambia, TheGeorgiaGermanyGhanaGreeceGreenlandGrenadaGuatemalaGuineaGuinea-BissauGuyanaHaitiHeavily indebted poor countries (HIPC)High incomeHondurasHong Kong SAR, ChinaHungaryIBRD onlyIcelandIDA & IBRD totalIDA blendIDA onlyIDA totalIndiaIndonesiaIran, Islamic Rep.IraqIrelandIsle of ManIsraelItalyJamaicaJapanJordanKazakhstanKenyaKiribatiKorea, Rep.KosovoKuwaitKyrgyz RepublicLao PDRLate-demographic dividendLatin America & Caribbean Latin America & Caribbean (excluding high income)Latin America & the Caribbean (IDA & IBRD countries)LatviaLeast developed countries: UN classificationLebanonLesothoLiberiaLibyaLiechtensteinLithuaniaLow & middle incomeLow incomeLower middle incomeLuxembourgMacao SAR, ChinaMacedonia, FYRMadagascarMalawiMalaysiaMaldivesMaliMaltaMarshall IslandsMauritaniaMauritiusMexicoMicronesia, Fed. Sts.Middle East & North AfricaMiddle East & North Africa (excluding high income)Middle East & North Africa (IDA & IBRD countries)Middle incomeMoldovaMonacoMongoliaMontenegroMoroccoMozambiqueMyanmarNamibiaNauruNepalNetherlandsNew CaledoniaNew ZealandNicaraguaNigerNigeriaNorth AmericaNorwayOECD membersOmanOther small statesPacific island small statesPakistanPalauPanamaPapua New GuineaParaguayPeruPhilippinesPolandPortugalPost-demographic dividendPre-demographic dividendPuerto RicoQatarRomaniaRussian FederationRwandaSamoaSan MarinoSao Tome and PrincipeSaudi ArabiaSenegalSerbiaSeychellesSierra LeoneSingaporeSlovak RepublicSloveniaSmall statesSolomon IslandsSomaliaSouth AfricaSouth AsiaSouth Asia (IDA & IBRD)South SudanSpainSri LankaSt. Kitts and NevisSt. LuciaSt. Vincent and the GrenadinesSub-Saharan Africa Sub-Saharan Africa (excluding high income)Sub-Saharan Africa (IDA & IBRD countries)SudanSurinameSwazilandSwedenSwitzerlandSyrian Arab RepublicTajikistanTanzaniaThailandTimor-LesteTogoTongaTrinidad and TobagoTunisiaTurkeyTurkmenistanTuvaluUgandaUkraineUnited Arab EmiratesUnited KingdomUnited StatesUpper middle incomeUruguayUzbekistanVanuatuVenezuela, RBVietnamVirgin Islands (U.S.)West Bank and GazaWorldYemen, Rep.ZambiaZimbabwe Timeline:
This timeline shows a graph from 1987 to 2016 of Tajikistan. No data until 1986. Number of actual observations by date: 30.
Source name:
World Development Indicators
Source organization:
World Bank national accounts data, and OECD National Accounts data files.
Categories, topics:
Economy & Growth
Last updated:
apr 23, 2017
Indicators value changes by year
Minimum:
-30.358
jan 1, 1993
Maximum:
10.271
jan 1, 1989
At the date of observation
Value
Absolute change
Change from previous value
jan 1, 1987
0.185
+0.185
0.0%
jan 1, 1988
-4.426
-4.612
-2.49K%
jan 1, 1989
10.271
+14.697
-332.06%
jan 1, 1990
-9.246
-19.517
-190.02%
jan 1, 1991
-3.169
+6.077
-65.72%
jan 1, 1992
-9.162
-5.993
189.12%
jan 1, 1993
-30.358
-21.196
231.34%
jan 1, 1994
-17.793
+12.565
-41.39%
jan 1, 1995
-22.484
-4.691
26.37%
jan 1, 1996
-13.638
+8.847
-39.35%
jan 1, 1997
-17.807
-4.169
30.57%
jan 1, 1998
0.423
+18.23
-102.37%
jan 1, 1999
3.977
+3.554
840.65%
jan 1, 2000
2.308
-1.669
-41.98%
jan 1, 2001
6.689
+4.381
189.85%
jan 1, 2002
8.373
+1.685
25.18%
jan 1, 2003
8.792
+0.418
5.0%
jan 1, 2004
8.853
+0.061
0.7%
jan 1, 2005
8.087
-0.766
-8.65%
jan 1, 2006
4.52
-3.567
-44.1%
jan 1, 2007
4.784
+0.264
5.84%
jan 1, 2008
5.53
+0.746
15.6%
jan 1, 2009
5.594
+0.063
1.14%
jan 1, 2010
1.548
-4.046
-72.33%
jan 1, 2011
4.158
+2.61
168.63%
jan 1, 2012
5.014
+0.857
20.6%
jan 1, 2013
5.101
+0.086
1.72%
jan 1, 2014
5.004
-0.097
-1.9%
jan 1, 2015
4.333
-0.671
-13.4%
jan 1, 2016
3.675
-0.658
-15.19%
Ranking of countries by current statistics by years


Comments: