29
/
en
AIzaSyAYiBZKx7MnpbEhh9jyipgxe19OcubqV5w
April 1, 2024
151577
Hong Kong SAR, China
HKG
true
2
1
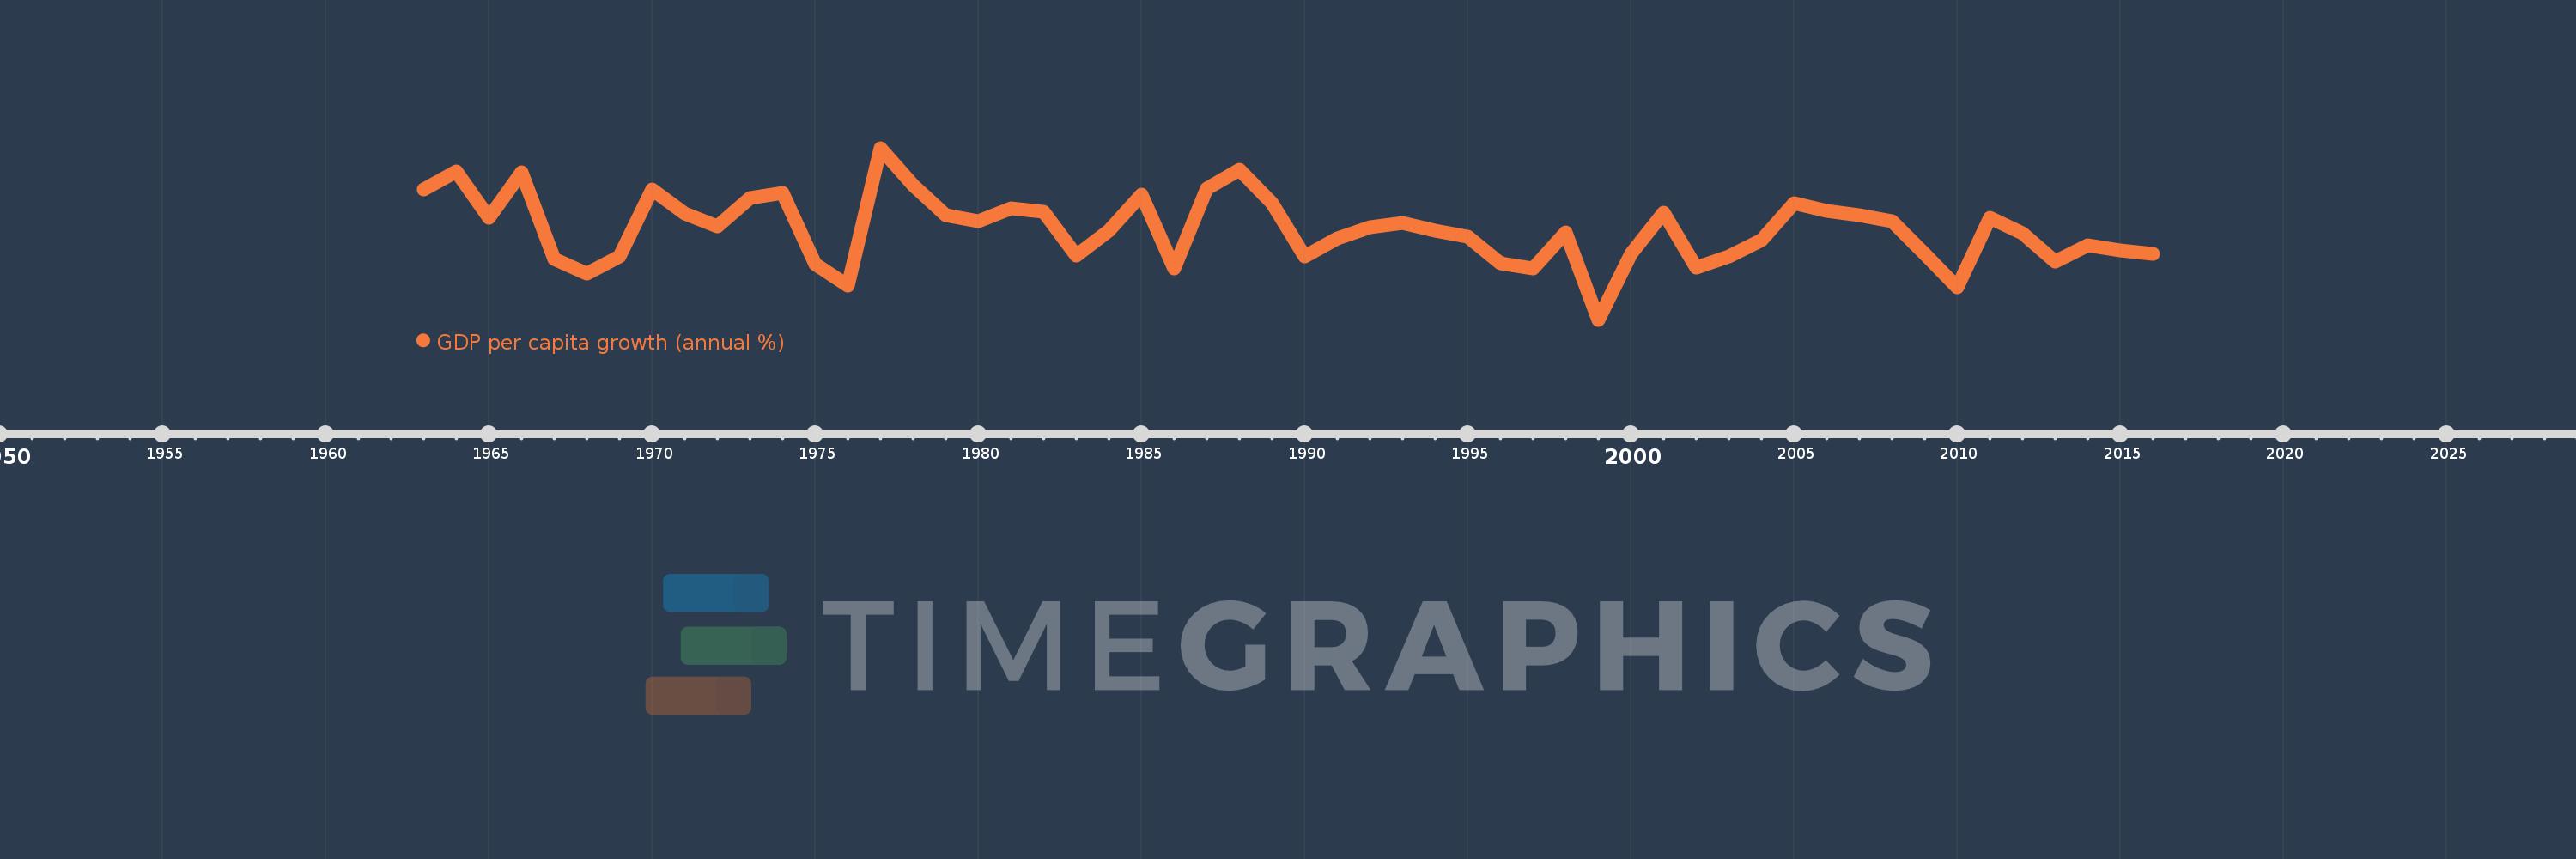
GDP per capita growth (annual %)
2016,2015,2014,2013,2012,2011,2010,2009,2008,2007,2006,2005,2004,2003,2002,2001,2000,1999,1998,1997,1996,1995,1994,1993,1992,1991,1990,1989,1988,1987,1986,1985,1984,1983,1982,1981,1980,1979,1978,1977,1976,1975,1974,1973,1972,1971,1970,1969,1968,1967,1966,1965,1964,1963
This statistics in other country:
AfghanistanAlbaniaAlgeriaAndorraAngolaAntigua and BarbudaArab WorldArgentinaArmeniaArubaAustraliaAustriaAzerbaijanBahamas, TheBahrainBangladeshBarbadosBelarusBelgiumBelizeBeninBermudaBhutanBoliviaBosnia and HerzegovinaBotswanaBrazilBrunei DarussalamBulgariaBurkina FasoBurundiCabo VerdeCambodiaCameroonCanadaCaribbean small statesCayman IslandsCentral African RepublicCentral Europe and the BalticsChadChannel IslandsChileChinaColombiaComorosCongo, Dem. Rep.Congo, Rep.Costa RicaCote d'IvoireCroatiaCubaCyprusCzech RepublicDenmarkDjiboutiDominicaDominican RepublicEarly-demographic dividendEast Asia & PacificEast Asia & Pacific (excluding high income)East Asia & Pacific (IDA & IBRD countries)EcuadorEgypt, Arab Rep.El SalvadorEquatorial GuineaEritreaEstoniaEthiopiaEuro areaEurope & Central AsiaEurope & Central Asia (excluding high income)Europe & Central Asia (IDA & IBRD countries)European UnionFijiFinlandFragile and conflict affected situationsFranceFrench PolynesiaGabonGambia, TheGeorgiaGermanyGhanaGreeceGreenlandGrenadaGuatemalaGuineaGuinea-BissauGuyanaHaitiHeavily indebted poor countries (HIPC)High incomeHondurasHong Kong SAR, ChinaHungaryIBRD onlyIcelandIDA & IBRD totalIDA blendIDA onlyIDA totalIndiaIndonesiaIran, Islamic Rep.IraqIrelandIsle of ManIsraelItalyJamaicaJapanJordanKazakhstanKenyaKiribatiKorea, Rep.KosovoKuwaitKyrgyz RepublicLao PDRLate-demographic dividendLatin America & Caribbean Latin America & Caribbean (excluding high income)Latin America & the Caribbean (IDA & IBRD countries)LatviaLeast developed countries: UN classificationLebanonLesothoLiberiaLibyaLiechtensteinLithuaniaLow & middle incomeLow incomeLower middle incomeLuxembourgMacao SAR, ChinaMacedonia, FYRMadagascarMalawiMalaysiaMaldivesMaliMaltaMarshall IslandsMauritaniaMauritiusMexicoMicronesia, Fed. Sts.Middle East & North AfricaMiddle East & North Africa (excluding high income)Middle East & North Africa (IDA & IBRD countries)Middle incomeMoldovaMonacoMongoliaMontenegroMoroccoMozambiqueMyanmarNamibiaNauruNepalNetherlandsNew CaledoniaNew ZealandNicaraguaNigerNigeriaNorth AmericaNorwayOECD membersOmanOther small statesPacific island small statesPakistanPalauPanamaPapua New GuineaParaguayPeruPhilippinesPolandPortugalPost-demographic dividendPre-demographic dividendPuerto RicoQatarRomaniaRussian FederationRwandaSamoaSan MarinoSao Tome and PrincipeSaudi ArabiaSenegalSerbiaSeychellesSierra LeoneSingaporeSlovak RepublicSloveniaSmall statesSolomon IslandsSomaliaSouth AfricaSouth AsiaSouth Asia (IDA & IBRD)South SudanSpainSri LankaSt. Kitts and NevisSt. LuciaSt. Vincent and the GrenadinesSub-Saharan Africa Sub-Saharan Africa (excluding high income)Sub-Saharan Africa (IDA & IBRD countries)SudanSurinameSwazilandSwedenSwitzerlandSyrian Arab RepublicTajikistanTanzaniaThailandTimor-LesteTogoTongaTrinidad and TobagoTunisiaTurkeyTurkmenistanTuvaluUgandaUkraineUnited Arab EmiratesUnited KingdomUnited StatesUpper middle incomeUruguayUzbekistanVanuatuVenezuela, RBVietnamVirgin Islands (U.S.)West Bank and GazaWorldYemen, Rep.ZambiaZimbabwe Timeline:
This timeline shows a graph from 1963 to 2016 of Hong Kong SAR, China. No data until 1962. Number of actual observations by date: 54.
Source name:
World Development Indicators
Source organization:
World Bank national accounts data, and OECD National Accounts data files.
Categories, topics:
Economy & Growth
Last updated:
apr 23, 2017
Indicators value changes by year
Minimum:
-6.665
jan 1, 1999
Maximum:
14.714
jan 1, 1977
At the date of observation
Value
Absolute change
Change from previous value
jan 1, 1963
9.55
+9.55
0.0%
jan 1, 1964
11.848
+2.298
24.06%
jan 1, 1965
6.034
-5.814
-49.07%
jan 1, 1966
11.669
+5.636
93.41%
jan 1, 1967
0.897
-10.772
-92.31%
jan 1, 1968
-0.932
-1.829
-203.9%
jan 1, 1969
1.225
+2.157
-231.42%
jan 1, 1970
9.58
+8.355
682.0%
jan 1, 1971
6.584
-2.996
-31.28%
jan 1, 1972
5.004
-1.579
-23.99%
jan 1, 1973
8.512
+3.508
70.09%
jan 1, 1974
9.156
+0.645
7.57%
jan 1, 1975
0.227
-8.929
-97.52%
jan 1, 1976
-2.377
-2.604
-1.15K%
jan 1, 1977
14.714
+17.091
-718.91%
jan 1, 1978
10.124
-4.59
-31.19%
jan 1, 1979
6.317
-3.807
-37.6%
jan 1, 1980
5.623
-0.694
-10.99%
jan 1, 1981
7.207
+1.584
28.17%
jan 1, 1982
6.725
-0.482
-6.69%
jan 1, 1983
1.364
-5.361
-79.72%
jan 1, 1984
4.379
+3.015
221.06%
jan 1, 1985
8.898
+4.519
103.2%
jan 1, 1986
-0.319
-9.217
-103.59%
jan 1, 1987
9.681
+10.001
-3.13K%
jan 1, 1988
12.062
+2.381
24.59%
jan 1, 1989
7.796
-4.266
-35.36%
jan 1, 1990
1.223
-6.573
-84.31%
jan 1, 1991
3.497
+2.274
185.96%
jan 1, 1992
4.829
+1.332
38.08%
jan 1, 1993
5.347
+0.518
10.72%
jan 1, 1994
4.392
-0.954
-17.85%
jan 1, 1995
3.675
-0.718
-16.34%
jan 1, 1996
0.367
-3.308
-90.03%
jan 1, 1997
-0.268
-0.634
-173.11%
jan 1, 1998
4.228
+4.496
-1.68K%
jan 1, 1999
-6.665
-10.893
-257.63%
jan 1, 2000
1.532
+8.197
-122.99%
jan 1, 2001
6.718
+5.186
338.43%
jan 1, 2002
-0.178
-6.896
-102.64%
jan 1, 2003
1.207
+1.385
-779.93%
jan 1, 2004
3.26
+2.052
169.98%
jan 1, 2005
7.856
+4.596
140.97%
jan 1, 2006
6.92
-0.936
-11.91%
jan 1, 2007
6.347
-0.573
-8.28%
jan 1, 2008
5.553
-0.794
-12.51%
jan 1, 2009
1.519
-4.035
-72.65%
jan 1, 2010
-2.669
-4.188
-275.73%
jan 1, 2011
5.986
+8.655
-324.3%
jan 1, 2012
4.112
-1.874
-31.31%
jan 1, 2013
0.52
-3.592
-87.34%
jan 1, 2014
2.616
+2.096
402.69%
jan 1, 2015
1.913
-0.703
-26.86%
jan 1, 2016
1.539
-0.374
-19.55%
Ranking of countries by current statistics by years


Comments: