29
/
en
AIzaSyAYiBZKx7MnpbEhh9jyipgxe19OcubqV5w
April 1, 2024
105985
China
CHN
true
2
1
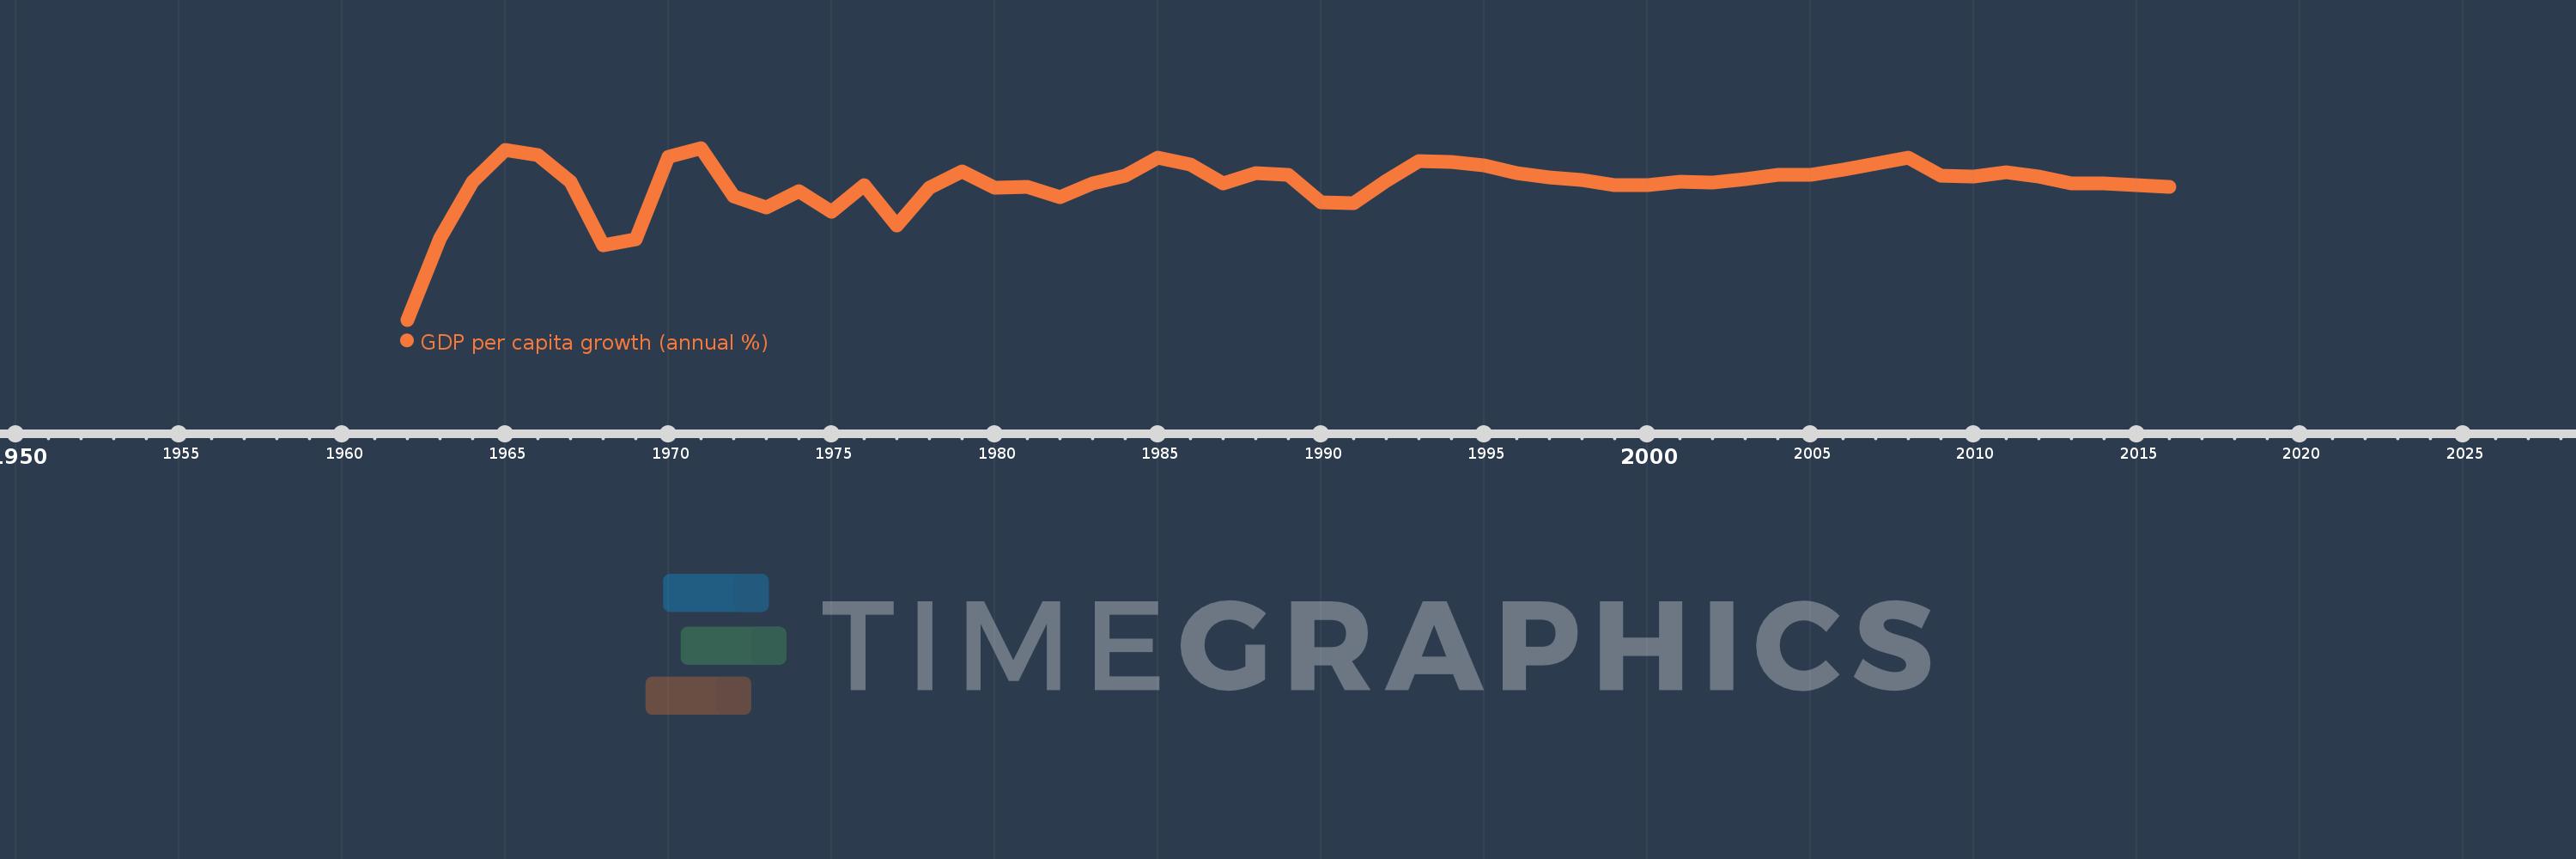
GDP per capita growth (annual %)
2016,2015,2014,2013,2012,2011,2010,2009,2008,2007,2006,2005,2004,2003,2002,2001,2000,1999,1998,1997,1996,1995,1994,1993,1992,1991,1990,1989,1988,1987,1986,1985,1984,1983,1982,1981,1980,1979,1978,1977,1976,1975,1974,1973,1972,1971,1970,1969,1968,1967,1966,1965,1964,1963,1962
This statistics in other country:
AfghanistanAlbaniaAlgeriaAndorraAngolaAntigua and BarbudaArab WorldArgentinaArmeniaArubaAustraliaAustriaAzerbaijanBahamas, TheBahrainBangladeshBarbadosBelarusBelgiumBelizeBeninBermudaBhutanBoliviaBosnia and HerzegovinaBotswanaBrazilBrunei DarussalamBulgariaBurkina FasoBurundiCabo VerdeCambodiaCameroonCanadaCaribbean small statesCayman IslandsCentral African RepublicCentral Europe and the BalticsChadChannel IslandsChileChinaColombiaComorosCongo, Dem. Rep.Congo, Rep.Costa RicaCote d'IvoireCroatiaCubaCyprusCzech RepublicDenmarkDjiboutiDominicaDominican RepublicEarly-demographic dividendEast Asia & PacificEast Asia & Pacific (excluding high income)East Asia & Pacific (IDA & IBRD countries)EcuadorEgypt, Arab Rep.El SalvadorEquatorial GuineaEritreaEstoniaEthiopiaEuro areaEurope & Central AsiaEurope & Central Asia (excluding high income)Europe & Central Asia (IDA & IBRD countries)European UnionFijiFinlandFragile and conflict affected situationsFranceFrench PolynesiaGabonGambia, TheGeorgiaGermanyGhanaGreeceGreenlandGrenadaGuatemalaGuineaGuinea-BissauGuyanaHaitiHeavily indebted poor countries (HIPC)High incomeHondurasHong Kong SAR, ChinaHungaryIBRD onlyIcelandIDA & IBRD totalIDA blendIDA onlyIDA totalIndiaIndonesiaIran, Islamic Rep.IraqIrelandIsle of ManIsraelItalyJamaicaJapanJordanKazakhstanKenyaKiribatiKorea, Rep.KosovoKuwaitKyrgyz RepublicLao PDRLate-demographic dividendLatin America & Caribbean Latin America & Caribbean (excluding high income)Latin America & the Caribbean (IDA & IBRD countries)LatviaLeast developed countries: UN classificationLebanonLesothoLiberiaLibyaLiechtensteinLithuaniaLow & middle incomeLow incomeLower middle incomeLuxembourgMacao SAR, ChinaMacedonia, FYRMadagascarMalawiMalaysiaMaldivesMaliMaltaMarshall IslandsMauritaniaMauritiusMexicoMicronesia, Fed. Sts.Middle East & North AfricaMiddle East & North Africa (excluding high income)Middle East & North Africa (IDA & IBRD countries)Middle incomeMoldovaMonacoMongoliaMontenegroMoroccoMozambiqueMyanmarNamibiaNauruNepalNetherlandsNew CaledoniaNew ZealandNicaraguaNigerNigeriaNorth AmericaNorwayOECD membersOmanOther small statesPacific island small statesPakistanPalauPanamaPapua New GuineaParaguayPeruPhilippinesPolandPortugalPost-demographic dividendPre-demographic dividendPuerto RicoQatarRomaniaRussian FederationRwandaSamoaSan MarinoSao Tome and PrincipeSaudi ArabiaSenegalSerbiaSeychellesSierra LeoneSingaporeSlovak RepublicSloveniaSmall statesSolomon IslandsSomaliaSouth AfricaSouth AsiaSouth Asia (IDA & IBRD)South SudanSpainSri LankaSt. Kitts and NevisSt. LuciaSt. Vincent and the GrenadinesSub-Saharan Africa Sub-Saharan Africa (excluding high income)Sub-Saharan Africa (IDA & IBRD countries)SudanSurinameSwazilandSwedenSwitzerlandSyrian Arab RepublicTajikistanTanzaniaThailandTimor-LesteTogoTongaTrinidad and TobagoTunisiaTurkeyTurkmenistanTuvaluUgandaUkraineUnited Arab EmiratesUnited KingdomUnited StatesUpper middle incomeUruguayUzbekistanVanuatuVenezuela, RBVietnamVirgin Islands (U.S.)West Bank and GazaWorldYemen, Rep.ZambiaZimbabwe Timeline:
This timeline shows a graph from 1962 to 2016 of China. No data until 1961. Number of actual observations by date: 55.
Source name:
World Development Indicators
Source organization:
World Bank national accounts data, and OECD National Accounts data files.
Categories, topics:
Economy & Growth
Last updated:
apr 23, 2017
Indicators value changes by year
Minimum:
-26.528
jan 1, 1962
At the date of observation
Value
Absolute change
Change from previous value
jan 1, 1962
-26.528
-26.528
0.0%
jan 1, 1963
-6.352
+20.176
-76.06%
jan 1, 1964
7.622
+13.974
-220.01%
jan 1, 1965
15.469
+7.847
102.95%
jan 1, 1966
14.198
-1.271
-8.22%
jan 1, 1967
7.608
-6.589
-46.41%
jan 1, 1968
-8.161
-15.77
-207.27%
jan 1, 1969
-6.571
+1.59
-19.48%
jan 1, 1970
13.779
+20.351
-309.68%
jan 1, 1971
16.05
+2.271
16.48%
jan 1, 1972
4.159
-11.891
-74.09%
jan 1, 1973
1.29
-2.869
-68.98%
jan 1, 1974
5.327
+4.037
312.93%
jan 1, 1975
0.218
-5.109
-95.91%
jan 1, 1976
6.816
+6.598
3.03K%
jan 1, 1977
-3.081
-9.898
-145.2%
jan 1, 1978
6.114
+9.195
-298.42%
jan 1, 1979
10.182
+4.068
66.54%
jan 1, 1980
6.174
-4.008
-39.36%
jan 1, 1981
6.463
+0.289
4.68%
jan 1, 1982
3.834
-2.629
-40.68%
jan 1, 1983
7.342
+3.508
91.51%
jan 1, 1984
9.245
+1.903
25.92%
jan 1, 1985
13.638
+4.393
47.52%
jan 1, 1986
11.909
-1.729
-12.68%
jan 1, 1987
7.331
-4.578
-38.44%
jan 1, 1988
9.912
+2.581
35.2%
jan 1, 1989
9.458
-0.454
-4.58%
jan 1, 1990
2.601
-6.857
-72.5%
jan 1, 1991
2.394
-0.207
-7.96%
jan 1, 1992
7.813
+5.419
226.41%
jan 1, 1993
12.825
+5.012
64.15%
jan 1, 1994
12.566
-0.259
-2.02%
jan 1, 1995
11.782
-0.784
-6.24%
jan 1, 1996
9.75
-2.031
-17.24%
jan 1, 1997
8.782
-0.968
-9.93%
jan 1, 1998
8.119
-0.664
-7.56%
jan 1, 1999
6.808
-1.311
-16.15%
jan 1, 2000
6.739
-0.069
-1.01%
jan 1, 2001
7.64
+0.901
13.37%
jan 1, 2002
7.556
-0.084
-1.1%
jan 1, 2003
8.402
+0.846
11.2%
jan 1, 2004
9.352
+0.95
11.31%
jan 1, 2005
9.459
+0.107
1.14%
jan 1, 2006
10.743
+1.283
13.57%
jan 1, 2007
12.092
+1.349
12.56%
jan 1, 2008
13.636
+1.545
12.77%
jan 1, 2009
9.094
-4.542
-33.31%
jan 1, 2010
8.857
-0.237
-2.6%
jan 1, 2011
10.103
+1.246
14.07%
jan 1, 2012
9.013
-1.09
-10.79%
jan 1, 2013
7.332
-1.681
-18.65%
jan 1, 2014
7.227
-0.105
-1.43%
jan 1, 2015
6.756
-0.471
-6.52%
jan 1, 2016
6.372
-0.383
-5.67%
Ranking of countries by current statistics by years


Comments: