29
/
en
AIzaSyAYiBZKx7MnpbEhh9jyipgxe19OcubqV5w
April 1, 2024
91146
Brazil
BRA
true
2
1
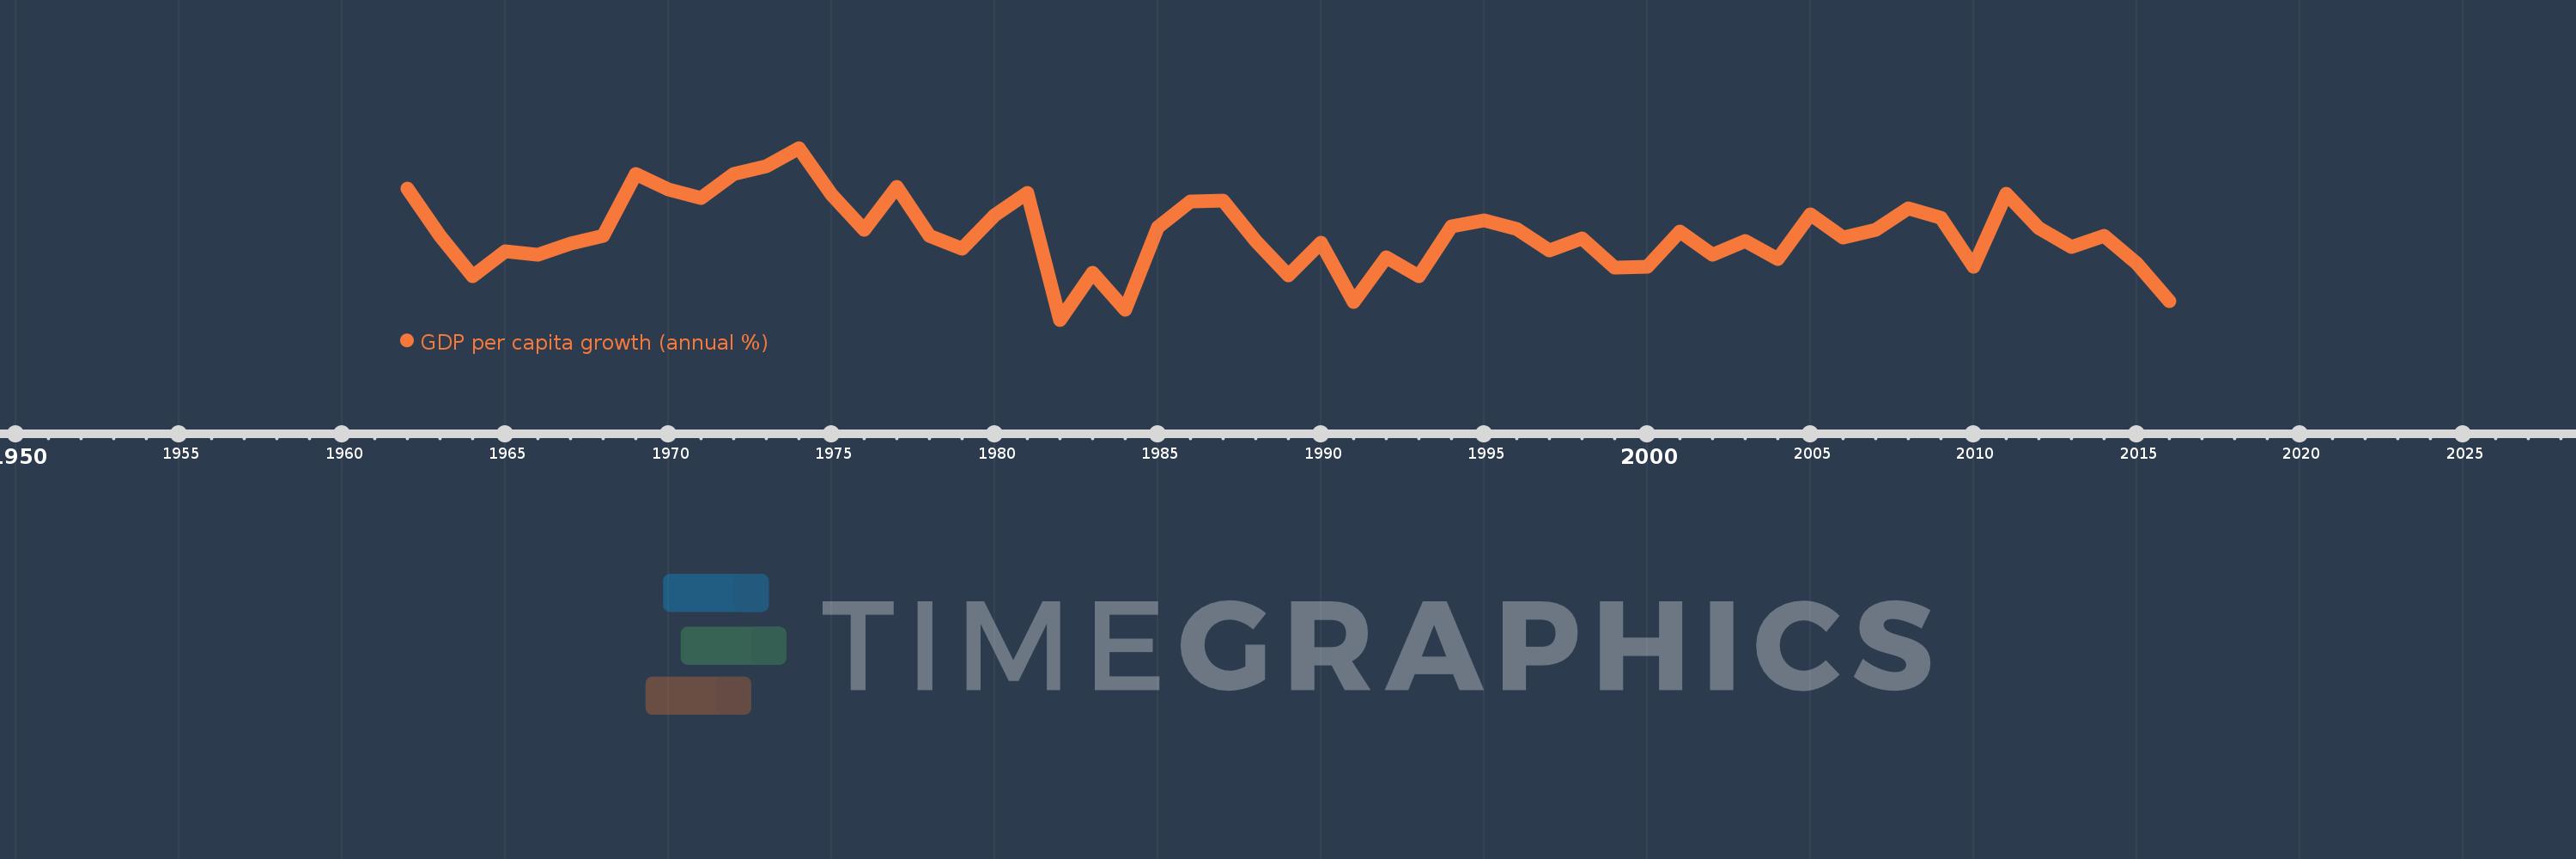
GDP per capita growth (annual %)
2016,2015,2014,2013,2012,2011,2010,2009,2008,2007,2006,2005,2004,2003,2002,2001,2000,1999,1998,1997,1996,1995,1994,1993,1992,1991,1990,1989,1988,1987,1986,1985,1984,1983,1982,1981,1980,1979,1978,1977,1976,1975,1974,1973,1972,1971,1970,1969,1968,1967,1966,1965,1964,1963,1962
This statistics in other country:
AfghanistanAlbaniaAlgeriaAndorraAngolaAntigua and BarbudaArab WorldArgentinaArmeniaArubaAustraliaAustriaAzerbaijanBahamas, TheBahrainBangladeshBarbadosBelarusBelgiumBelizeBeninBermudaBhutanBoliviaBosnia and HerzegovinaBotswanaBrazilBrunei DarussalamBulgariaBurkina FasoBurundiCabo VerdeCambodiaCameroonCanadaCaribbean small statesCayman IslandsCentral African RepublicCentral Europe and the BalticsChadChannel IslandsChileChinaColombiaComorosCongo, Dem. Rep.Congo, Rep.Costa RicaCote d'IvoireCroatiaCubaCyprusCzech RepublicDenmarkDjiboutiDominicaDominican RepublicEarly-demographic dividendEast Asia & PacificEast Asia & Pacific (excluding high income)East Asia & Pacific (IDA & IBRD countries)EcuadorEgypt, Arab Rep.El SalvadorEquatorial GuineaEritreaEstoniaEthiopiaEuro areaEurope & Central AsiaEurope & Central Asia (excluding high income)Europe & Central Asia (IDA & IBRD countries)European UnionFijiFinlandFragile and conflict affected situationsFranceFrench PolynesiaGabonGambia, TheGeorgiaGermanyGhanaGreeceGreenlandGrenadaGuatemalaGuineaGuinea-BissauGuyanaHaitiHeavily indebted poor countries (HIPC)High incomeHondurasHong Kong SAR, ChinaHungaryIBRD onlyIcelandIDA & IBRD totalIDA blendIDA onlyIDA totalIndiaIndonesiaIran, Islamic Rep.IraqIrelandIsle of ManIsraelItalyJamaicaJapanJordanKazakhstanKenyaKiribatiKorea, Rep.KosovoKuwaitKyrgyz RepublicLao PDRLate-demographic dividendLatin America & Caribbean Latin America & Caribbean (excluding high income)Latin America & the Caribbean (IDA & IBRD countries)LatviaLeast developed countries: UN classificationLebanonLesothoLiberiaLibyaLiechtensteinLithuaniaLow & middle incomeLow incomeLower middle incomeLuxembourgMacao SAR, ChinaMacedonia, FYRMadagascarMalawiMalaysiaMaldivesMaliMaltaMarshall IslandsMauritaniaMauritiusMexicoMicronesia, Fed. Sts.Middle East & North AfricaMiddle East & North Africa (excluding high income)Middle East & North Africa (IDA & IBRD countries)Middle incomeMoldovaMonacoMongoliaMontenegroMoroccoMozambiqueMyanmarNamibiaNauruNepalNetherlandsNew CaledoniaNew ZealandNicaraguaNigerNigeriaNorth AmericaNorwayOECD membersOmanOther small statesPacific island small statesPakistanPalauPanamaPapua New GuineaParaguayPeruPhilippinesPolandPortugalPost-demographic dividendPre-demographic dividendPuerto RicoQatarRomaniaRussian FederationRwandaSamoaSan MarinoSao Tome and PrincipeSaudi ArabiaSenegalSerbiaSeychellesSierra LeoneSingaporeSlovak RepublicSloveniaSmall statesSolomon IslandsSomaliaSouth AfricaSouth AsiaSouth Asia (IDA & IBRD)South SudanSpainSri LankaSt. Kitts and NevisSt. LuciaSt. Vincent and the GrenadinesSub-Saharan Africa Sub-Saharan Africa (excluding high income)Sub-Saharan Africa (IDA & IBRD countries)SudanSurinameSwazilandSwedenSwitzerlandSyrian Arab RepublicTajikistanTanzaniaThailandTimor-LesteTogoTongaTrinidad and TobagoTunisiaTurkeyTurkmenistanTuvaluUgandaUkraineUnited Arab EmiratesUnited KingdomUnited StatesUpper middle incomeUruguayUzbekistanVanuatuVenezuela, RBVietnamVirgin Islands (U.S.)West Bank and GazaWorldYemen, Rep.ZambiaZimbabwe Timeline:
This timeline shows a graph from 1962 to 2016 of Brazil. No data until 1961. Number of actual observations by date: 55.
Source name:
World Development Indicators
Source organization:
World Bank national accounts data, and OECD National Accounts data files.
Categories, topics:
Economy & Growth
Last updated:
apr 23, 2017
Indicators value changes by year
Minimum:
-6.615
jan 1, 1982
Maximum:
11.247
jan 1, 1974
At the date of observation
Value
Absolute change
Change from previous value
jan 1, 1962
7.009
+7.009
0.0%
jan 1, 1963
2.073
-4.936
-70.43%
jan 1, 1964
-2.126
-4.199
-202.57%
jan 1, 1965
0.469
+2.595
-122.04%
jan 1, 1966
0.14
-0.328
-70.06%
jan 1, 1967
1.303
+1.162
828.61%
jan 1, 1968
2.13
+0.828
63.52%
jan 1, 1969
8.545
+6.415
301.14%
jan 1, 1970
6.954
-1.591
-18.62%
jan 1, 1971
6.054
-0.9
-12.94%
jan 1, 1972
8.558
+2.504
41.37%
jan 1, 1973
9.339
+0.781
9.12%
jan 1, 1974
11.247
+1.908
20.43%
jan 1, 1975
6.44
-4.806
-42.74%
jan 1, 1976
2.701
-3.739
-58.06%
jan 1, 1977
7.176
+4.475
165.7%
jan 1, 1978
2.124
-5.053
-70.41%
jan 1, 1979
0.791
-1.333
-62.77%
jan 1, 1980
4.253
+3.462
437.98%
jan 1, 1981
6.559
+2.306
54.22%
jan 1, 1982
-6.615
-13.174
-200.86%
jan 1, 1983
-1.735
+4.881
-73.78%
jan 1, 1984
-5.592
-3.857
222.33%
jan 1, 1985
2.962
+8.553
-152.96%
jan 1, 1986
5.669
+2.708
91.42%
jan 1, 1987
5.802
+0.132
2.33%
jan 1, 1988
1.583
-4.219
-72.72%
jan 1, 1989
-1.97
-3.553
-224.45%
jan 1, 1990
1.427
+3.397
-172.43%
jan 1, 1991
-4.772
-6.199
-434.46%
jan 1, 1992
-0.163
+4.609
-96.58%
jan 1, 1993
-2.044
-1.881
1.15K%
jan 1, 1994
3.051
+5.096
-249.28%
jan 1, 1995
3.725
+0.674
22.09%
jan 1, 1996
2.816
-0.909
-24.4%
jan 1, 1997
0.632
-2.184
-77.56%
jan 1, 1998
1.8
+1.168
184.73%
jan 1, 1999
-1.205
-3.005
-166.95%
jan 1, 2000
-1.061
+0.144
-11.96%
jan 1, 2001
2.553
+3.614
-340.67%
jan 1, 2002
0.158
-2.395
-93.82%
jan 1, 2003
1.558
+1.401
888.51%
jan 1, 2004
-0.282
-1.84
-118.08%
jan 1, 2005
4.346
+4.628
-1.64K%
jan 1, 2006
1.908
-2.438
-56.1%
jan 1, 2007
2.751
+0.843
44.15%
jan 1, 2008
4.924
+2.174
79.02%
jan 1, 2009
4.023
-0.902
-18.31%
jan 1, 2010
-1.107
-5.13
-127.52%
jan 1, 2011
6.493
+7.6
-686.6%
jan 1, 2012
2.924
-3.569
-54.97%
jan 1, 2013
0.967
-1.957
-66.93%
jan 1, 2014
2.078
+1.111
114.95%
jan 1, 2015
-0.78
-2.858
-137.53%
jan 1, 2016
-4.666
-3.886
498.22%
Ranking of countries by current statistics by years


Comments: