29
/
en
AIzaSyAYiBZKx7MnpbEhh9jyipgxe19OcubqV5w
April 1, 2024
162557
Jamaica
JAM
true
2
1
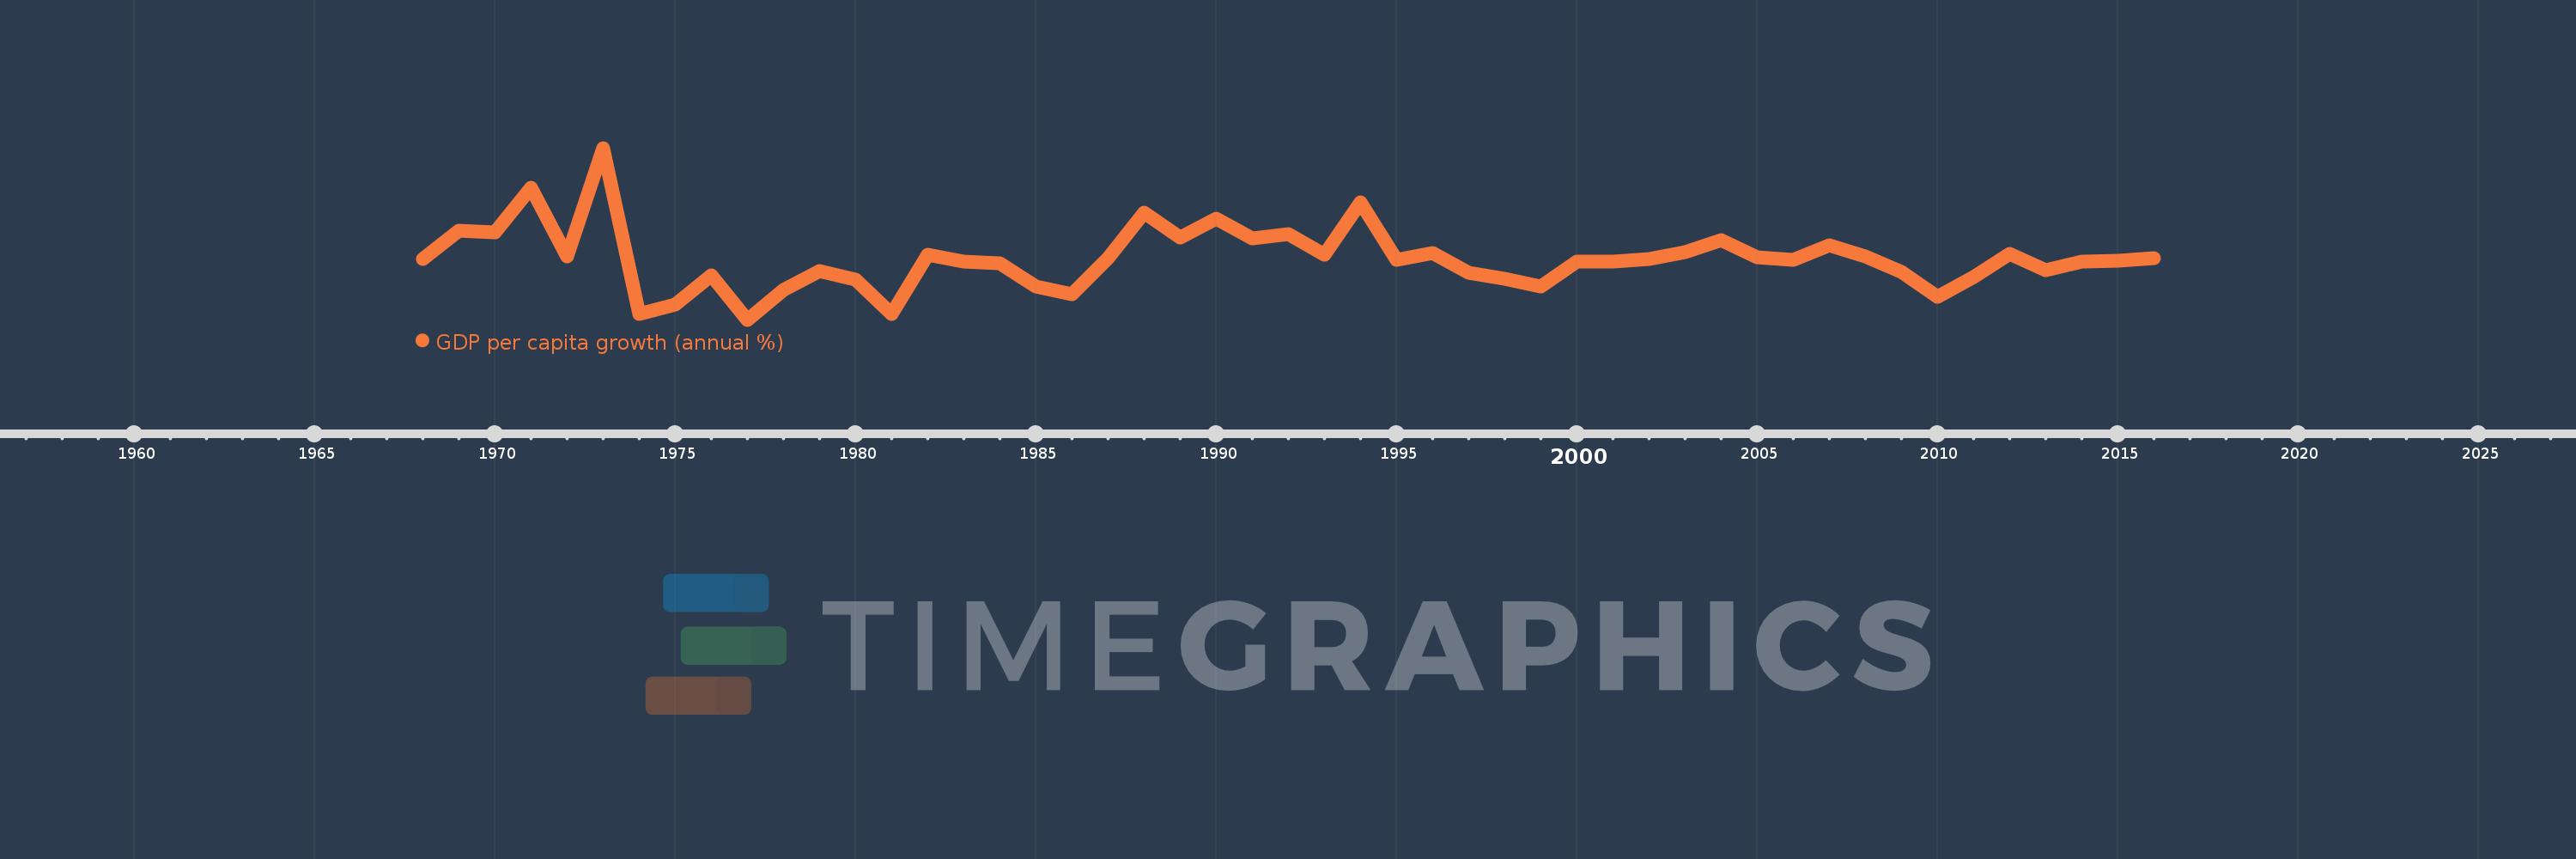
GDP per capita growth (annual %)
2016,2015,2014,2013,2012,2011,2010,2009,2008,2007,2006,2005,2004,2003,2002,2001,2000,1999,1998,1997,1996,1995,1994,1993,1992,1991,1990,1989,1988,1987,1986,1985,1984,1983,1982,1981,1980,1979,1978,1977,1976,1975,1974,1973,1972,1971,1970,1969,1968
This statistics in other country:
AfghanistanAlbaniaAlgeriaAndorraAngolaAntigua and BarbudaArab WorldArgentinaArmeniaArubaAustraliaAustriaAzerbaijanBahamas, TheBahrainBangladeshBarbadosBelarusBelgiumBelizeBeninBermudaBhutanBoliviaBosnia and HerzegovinaBotswanaBrazilBrunei DarussalamBulgariaBurkina FasoBurundiCabo VerdeCambodiaCameroonCanadaCaribbean small statesCayman IslandsCentral African RepublicCentral Europe and the BalticsChadChannel IslandsChileChinaColombiaComorosCongo, Dem. Rep.Congo, Rep.Costa RicaCote d'IvoireCroatiaCubaCyprusCzech RepublicDenmarkDjiboutiDominicaDominican RepublicEarly-demographic dividendEast Asia & PacificEast Asia & Pacific (excluding high income)East Asia & Pacific (IDA & IBRD countries)EcuadorEgypt, Arab Rep.El SalvadorEquatorial GuineaEritreaEstoniaEthiopiaEuro areaEurope & Central AsiaEurope & Central Asia (excluding high income)Europe & Central Asia (IDA & IBRD countries)European UnionFijiFinlandFragile and conflict affected situationsFranceFrench PolynesiaGabonGambia, TheGeorgiaGermanyGhanaGreeceGreenlandGrenadaGuatemalaGuineaGuinea-BissauGuyanaHaitiHeavily indebted poor countries (HIPC)High incomeHondurasHong Kong SAR, ChinaHungaryIBRD onlyIcelandIDA & IBRD totalIDA blendIDA onlyIDA totalIndiaIndonesiaIran, Islamic Rep.IraqIrelandIsle of ManIsraelItalyJamaicaJapanJordanKazakhstanKenyaKiribatiKorea, Rep.KosovoKuwaitKyrgyz RepublicLao PDRLate-demographic dividendLatin America & Caribbean Latin America & Caribbean (excluding high income)Latin America & the Caribbean (IDA & IBRD countries)LatviaLeast developed countries: UN classificationLebanonLesothoLiberiaLibyaLiechtensteinLithuaniaLow & middle incomeLow incomeLower middle incomeLuxembourgMacao SAR, ChinaMacedonia, FYRMadagascarMalawiMalaysiaMaldivesMaliMaltaMarshall IslandsMauritaniaMauritiusMexicoMicronesia, Fed. Sts.Middle East & North AfricaMiddle East & North Africa (excluding high income)Middle East & North Africa (IDA & IBRD countries)Middle incomeMoldovaMonacoMongoliaMontenegroMoroccoMozambiqueMyanmarNamibiaNauruNepalNetherlandsNew CaledoniaNew ZealandNicaraguaNigerNigeriaNorth AmericaNorwayOECD membersOmanOther small statesPacific island small statesPakistanPalauPanamaPapua New GuineaParaguayPeruPhilippinesPolandPortugalPost-demographic dividendPre-demographic dividendPuerto RicoQatarRomaniaRussian FederationRwandaSamoaSan MarinoSao Tome and PrincipeSaudi ArabiaSenegalSerbiaSeychellesSierra LeoneSingaporeSlovak RepublicSloveniaSmall statesSolomon IslandsSomaliaSouth AfricaSouth AsiaSouth Asia (IDA & IBRD)South SudanSpainSri LankaSt. Kitts and NevisSt. LuciaSt. Vincent and the GrenadinesSub-Saharan Africa Sub-Saharan Africa (excluding high income)Sub-Saharan Africa (IDA & IBRD countries)SudanSurinameSwazilandSwedenSwitzerlandSyrian Arab RepublicTajikistanTanzaniaThailandTimor-LesteTogoTongaTrinidad and TobagoTunisiaTurkeyTurkmenistanTuvaluUgandaUkraineUnited Arab EmiratesUnited KingdomUnited StatesUpper middle incomeUruguayUzbekistanVanuatuVenezuela, RBVietnamVirgin Islands (U.S.)West Bank and GazaWorldYemen, Rep.ZambiaZimbabwe Timeline:
This timeline shows a graph from 1968 to 2016 of Jamaica. No data until 1967. Number of actual observations by date: 49.
Source name:
World Development Indicators
Source organization:
World Bank national accounts data, and OECD National Accounts data files.
Categories, topics:
Economy & Growth
Last updated:
apr 23, 2017
Indicators value changes by year
Minimum:
-7.826
jan 1, 1977
Maximum:
16.198
jan 1, 1973
At the date of observation
Value
Absolute change
Change from previous value
jan 1, 1968
0.637
+0.637
0.0%
jan 1, 1969
4.595
+3.959
621.79%
jan 1, 1970
4.36
-0.235
-5.12%
jan 1, 1971
10.622
+6.262
143.62%
jan 1, 1972
1.019
-9.603
-90.41%
jan 1, 1973
16.198
+15.179
1.49K%
jan 1, 1974
-6.979
-23.178
-143.09%
jan 1, 1975
-5.665
+1.314
-18.83%
jan 1, 1976
-1.601
+4.064
-71.73%
jan 1, 1977
-7.826
-6.225
388.73%
jan 1, 1978
-3.623
+4.203
-53.7%
jan 1, 1979
-1.058
+2.565
-70.79%
jan 1, 1980
-2.181
-1.123
106.08%
jan 1, 1981
-6.99
-4.809
220.52%
jan 1, 1982
1.249
+8.238
-117.86%
jan 1, 1983
0.316
-0.933
-74.73%
jan 1, 1984
0.058
-0.257
-81.59%
jan 1, 1985
-3.231
-3.289
-5.66K%
jan 1, 1986
-4.254
-1.023
31.66%
jan 1, 1987
0.805
+5.059
-118.93%
jan 1, 1988
7.171
+6.366
790.59%
jan 1, 1989
3.718
-3.453
-48.15%
jan 1, 1990
6.338
+2.62
70.46%
jan 1, 1991
3.542
-2.796
-44.12%
jan 1, 1992
4.139
+0.597
16.86%
jan 1, 1993
1.24
-2.899
-70.04%
jan 1, 1994
8.611
+7.371
594.37%
jan 1, 1995
0.601
-8.01
-93.02%
jan 1, 1996
1.525
+0.923
153.58%
jan 1, 1997
-1.305
-2.829
-185.57%
jan 1, 1998
-2.082
-0.778
59.63%
jan 1, 1999
-3.202
-1.12
53.77%
jan 1, 2000
0.36
+3.562
-111.26%
jan 1, 2001
0.29
-0.07
-19.41%
jan 1, 2002
0.716
+0.426
146.57%
jan 1, 2003
1.619
+0.903
126.1%
jan 1, 2004
3.293
+1.674
103.41%
jan 1, 2005
0.96
-2.333
-70.84%
jan 1, 2006
0.533
-0.427
-44.5%
jan 1, 2007
2.533
+2.0
375.31%
jan 1, 2008
1.072
-1.461
-57.66%
jan 1, 2009
-1.164
-2.236
-208.51%
jan 1, 2010
-4.67
-3.506
301.32%
jan 1, 2011
-1.815
+2.855
-61.14%
jan 1, 2012
1.389
+3.204
-176.57%
jan 1, 2013
-0.914
-2.304
-165.81%
jan 1, 2014
0.25
+1.164
-127.29%
jan 1, 2015
0.477
+0.227
91.09%
jan 1, 2016
0.797
+0.32
67.14%
Ranking of countries by current statistics by years


Comments: