29
/
en
AIzaSyAYiBZKx7MnpbEhh9jyipgxe19OcubqV5w
April 1, 2024
192265
Marshall Islands
MHL
true
2
1
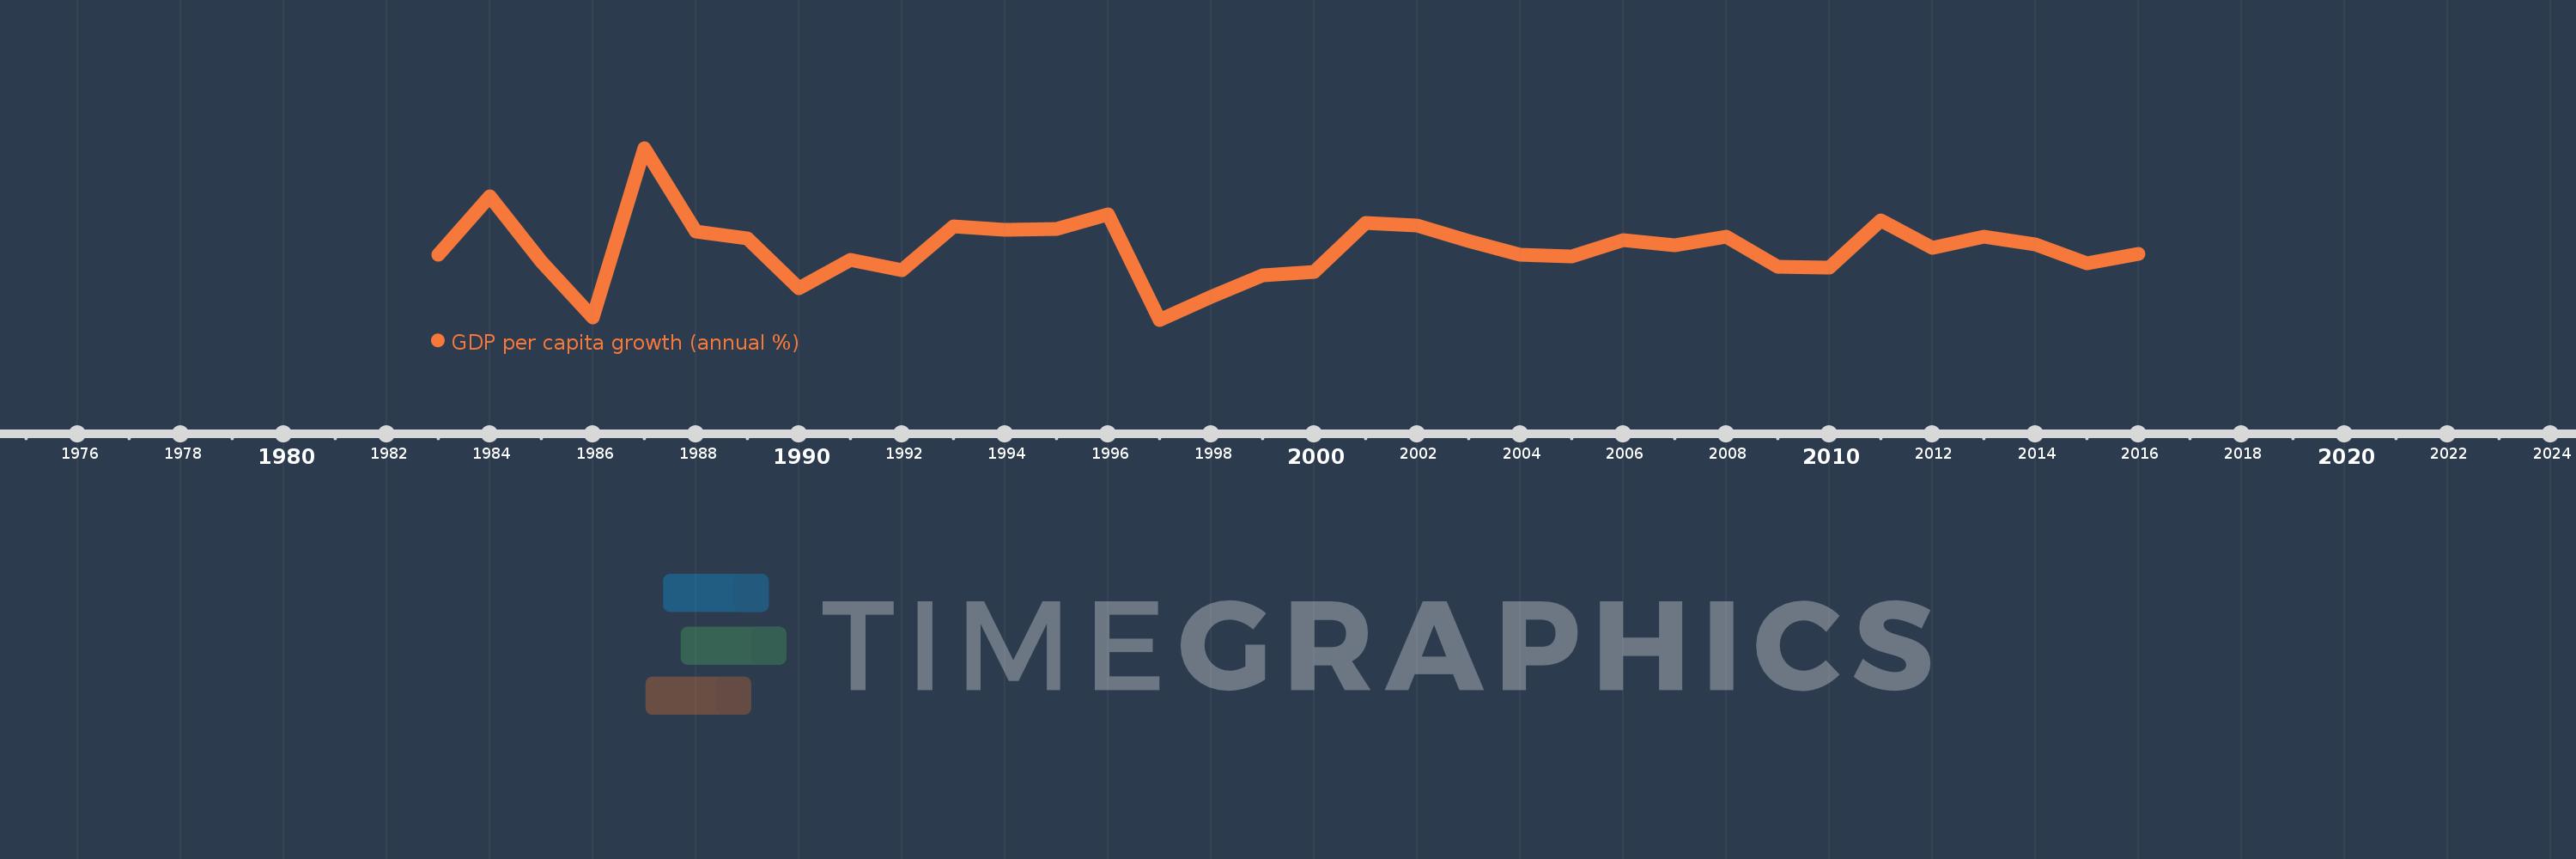
GDP per capita growth (annual %)
2016,2015,2014,2013,2012,2011,2010,2009,2008,2007,2006,2005,2004,2003,2002,2001,2000,1999,1998,1997,1996,1995,1994,1993,1992,1991,1990,1989,1988,1987,1986,1985,1984,1983
This statistics in other country:
AfghanistanAlbaniaAlgeriaAndorraAngolaAntigua and BarbudaArab WorldArgentinaArmeniaArubaAustraliaAustriaAzerbaijanBahamas, TheBahrainBangladeshBarbadosBelarusBelgiumBelizeBeninBermudaBhutanBoliviaBosnia and HerzegovinaBotswanaBrazilBrunei DarussalamBulgariaBurkina FasoBurundiCabo VerdeCambodiaCameroonCanadaCaribbean small statesCayman IslandsCentral African RepublicCentral Europe and the BalticsChadChannel IslandsChileChinaColombiaComorosCongo, Dem. Rep.Congo, Rep.Costa RicaCote d'IvoireCroatiaCubaCyprusCzech RepublicDenmarkDjiboutiDominicaDominican RepublicEarly-demographic dividendEast Asia & PacificEast Asia & Pacific (excluding high income)East Asia & Pacific (IDA & IBRD countries)EcuadorEgypt, Arab Rep.El SalvadorEquatorial GuineaEritreaEstoniaEthiopiaEuro areaEurope & Central AsiaEurope & Central Asia (excluding high income)Europe & Central Asia (IDA & IBRD countries)European UnionFijiFinlandFragile and conflict affected situationsFranceFrench PolynesiaGabonGambia, TheGeorgiaGermanyGhanaGreeceGreenlandGrenadaGuatemalaGuineaGuinea-BissauGuyanaHaitiHeavily indebted poor countries (HIPC)High incomeHondurasHong Kong SAR, ChinaHungaryIBRD onlyIcelandIDA & IBRD totalIDA blendIDA onlyIDA totalIndiaIndonesiaIran, Islamic Rep.IraqIrelandIsle of ManIsraelItalyJamaicaJapanJordanKazakhstanKenyaKiribatiKorea, Rep.KosovoKuwaitKyrgyz RepublicLao PDRLate-demographic dividendLatin America & Caribbean Latin America & Caribbean (excluding high income)Latin America & the Caribbean (IDA & IBRD countries)LatviaLeast developed countries: UN classificationLebanonLesothoLiberiaLibyaLiechtensteinLithuaniaLow & middle incomeLow incomeLower middle incomeLuxembourgMacao SAR, ChinaMacedonia, FYRMadagascarMalawiMalaysiaMaldivesMaliMaltaMarshall IslandsMauritaniaMauritiusMexicoMicronesia, Fed. Sts.Middle East & North AfricaMiddle East & North Africa (excluding high income)Middle East & North Africa (IDA & IBRD countries)Middle incomeMoldovaMonacoMongoliaMontenegroMoroccoMozambiqueMyanmarNamibiaNauruNepalNetherlandsNew CaledoniaNew ZealandNicaraguaNigerNigeriaNorth AmericaNorwayOECD membersOmanOther small statesPacific island small statesPakistanPalauPanamaPapua New GuineaParaguayPeruPhilippinesPolandPortugalPost-demographic dividendPre-demographic dividendPuerto RicoQatarRomaniaRussian FederationRwandaSamoaSan MarinoSao Tome and PrincipeSaudi ArabiaSenegalSerbiaSeychellesSierra LeoneSingaporeSlovak RepublicSloveniaSmall statesSolomon IslandsSomaliaSouth AfricaSouth AsiaSouth Asia (IDA & IBRD)South SudanSpainSri LankaSt. Kitts and NevisSt. LuciaSt. Vincent and the GrenadinesSub-Saharan Africa Sub-Saharan Africa (excluding high income)Sub-Saharan Africa (IDA & IBRD countries)SudanSurinameSwazilandSwedenSwitzerlandSyrian Arab RepublicTajikistanTanzaniaThailandTimor-LesteTogoTongaTrinidad and TobagoTunisiaTurkeyTurkmenistanTuvaluUgandaUkraineUnited Arab EmiratesUnited KingdomUnited StatesUpper middle incomeUruguayUzbekistanVanuatuVenezuela, RBVietnamVirgin Islands (U.S.)West Bank and GazaWorldYemen, Rep.ZambiaZimbabwe Timeline:
This timeline shows a graph from 1983 to 2016 of Marshall Islands. No data until 1982. Number of actual observations by date: 34.
Source name:
World Development Indicators
Source organization:
World Bank national accounts data, and OECD National Accounts data files.
Categories, topics:
Economy & Growth
Last updated:
apr 23, 2017
Indicators value changes by year
Minimum:
-10.961
jan 1, 1997
Maximum:
18.753
jan 1, 1987
At the date of observation
Value
Absolute change
Change from previous value
jan 1, 1983
0.306
+0.306
0.0%
jan 1, 1984
10.341
+10.035
3.28K%
jan 1, 1985
-0.883
-11.224
-108.54%
jan 1, 1986
-10.578
-9.695
1.1K%
jan 1, 1987
18.753
+29.331
-277.27%
jan 1, 1988
4.317
-14.436
-76.98%
jan 1, 1989
3.104
-1.212
-28.09%
jan 1, 1990
-5.447
-8.551
-275.45%
jan 1, 1991
-0.552
+4.895
-89.87%
jan 1, 1992
-2.35
-1.799
326.04%
jan 1, 1993
5.186
+7.536
-320.65%
jan 1, 1994
4.587
-0.599
-11.55%
jan 1, 1995
4.779
+0.191
4.17%
jan 1, 1996
7.274
+2.495
52.21%
jan 1, 1997
-10.961
-18.234
-250.69%
jan 1, 1998
-6.989
+3.972
-36.24%
jan 1, 1999
-3.265
+3.723
-53.28%
jan 1, 2000
-2.686
+0.579
-17.75%
jan 1, 2001
5.718
+8.404
-312.9%
jan 1, 2002
5.317
-0.401
-7.02%
jan 1, 2003
2.661
-2.656
-49.95%
jan 1, 2004
0.259
-2.403
-90.28%
jan 1, 2005
0.023
-0.235
-91.0%
jan 1, 2006
2.782
+2.759
11.85K%
jan 1, 2007
1.88
-0.901
-32.4%
jan 1, 2008
3.443
+1.563
83.12%
jan 1, 2009
-1.796
-5.239
-152.16%
jan 1, 2010
-1.897
-0.101
5.64%
jan 1, 2011
6.221
+8.118
-427.86%
jan 1, 2012
1.458
-4.762
-76.56%
jan 1, 2013
3.46
+2.001
137.23%
jan 1, 2014
2.121
-1.339
-38.7%
jan 1, 2015
-1.159
-3.28
-154.67%
jan 1, 2016
0.454
+1.613
-139.16%
Ranking of countries by current statistics by years


Comments: