29
/
en
AIzaSyAYiBZKx7MnpbEhh9jyipgxe19OcubqV5w
April 1, 2024
161468
Italy
ITA
true
2
1
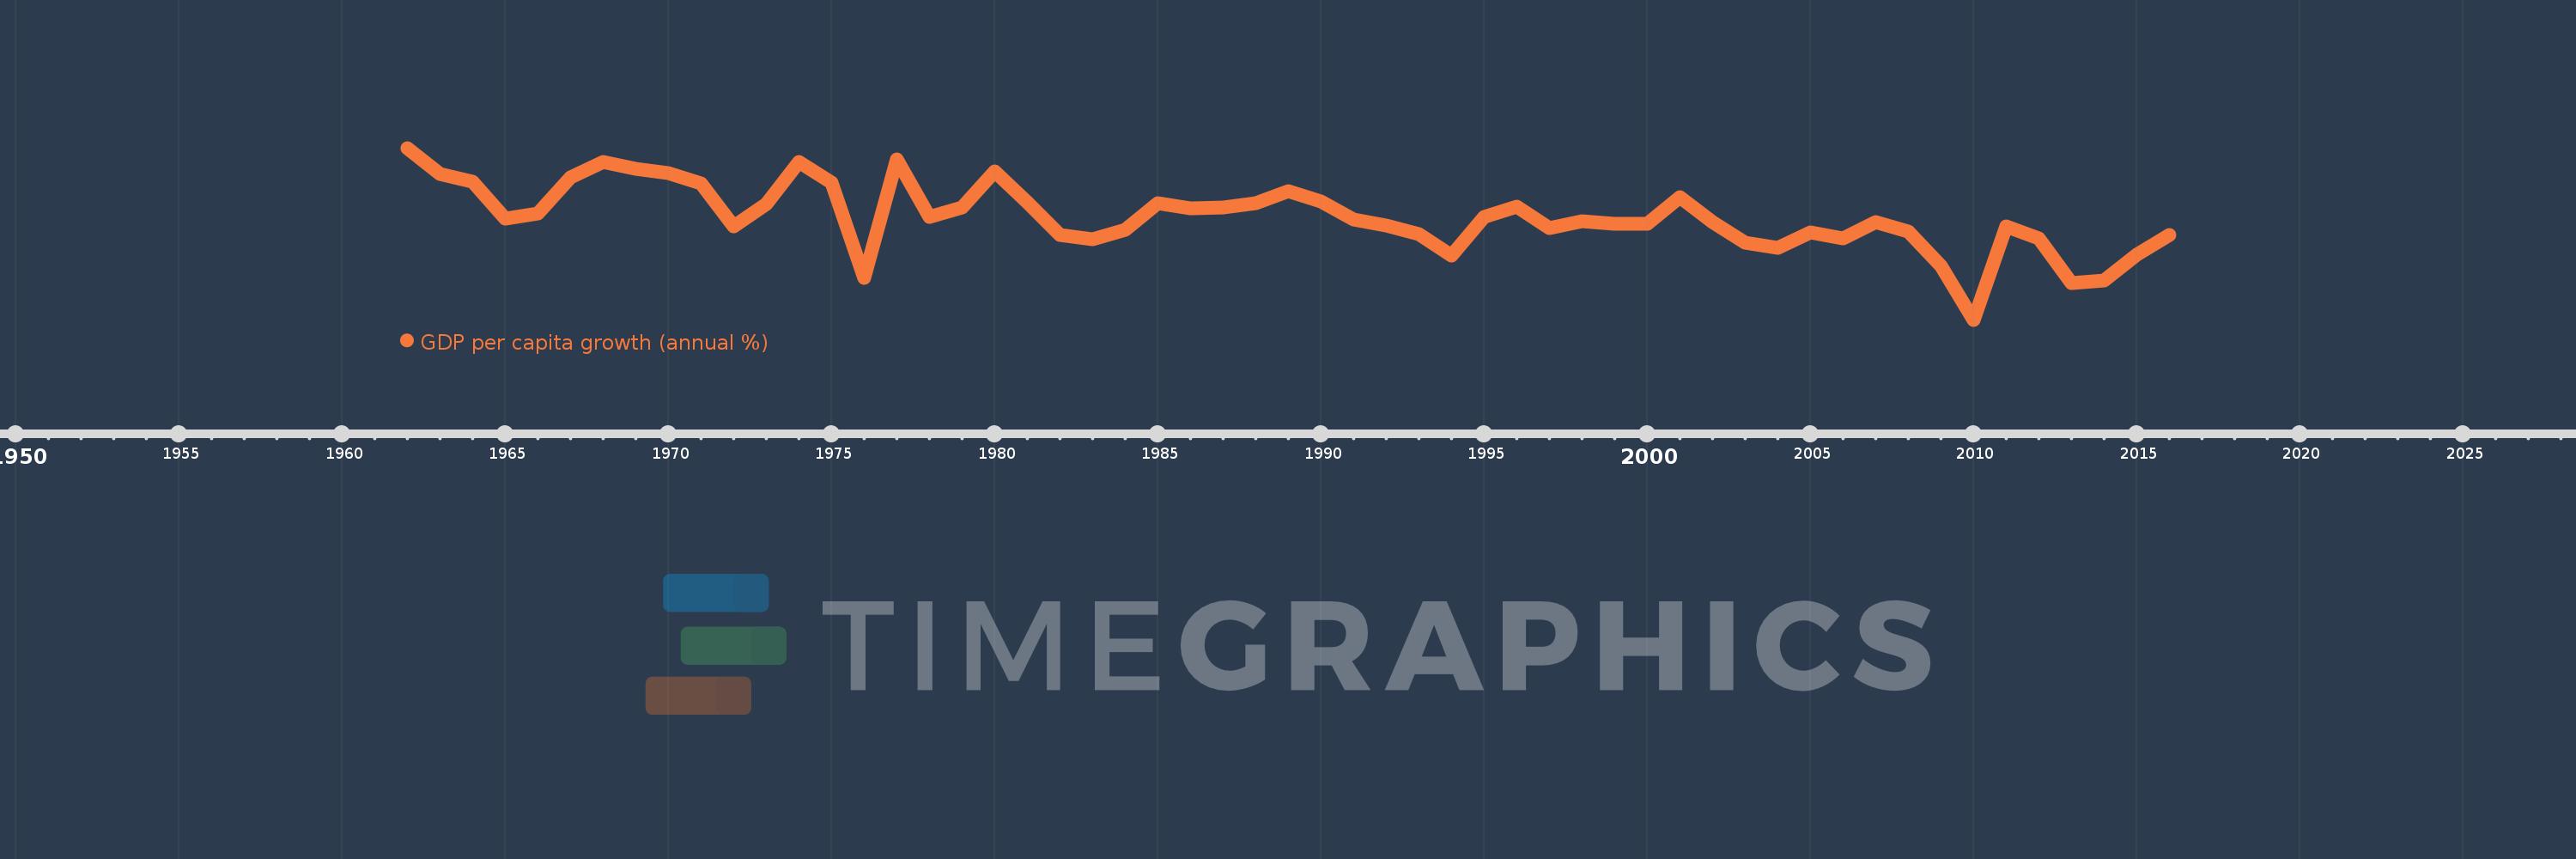
GDP per capita growth (annual %)
2016,2015,2014,2013,2012,2011,2010,2009,2008,2007,2006,2005,2004,2003,2002,2001,2000,1999,1998,1997,1996,1995,1994,1993,1992,1991,1990,1989,1988,1987,1986,1985,1984,1983,1982,1981,1980,1979,1978,1977,1976,1975,1974,1973,1972,1971,1970,1969,1968,1967,1966,1965,1964,1963,1962
This statistics in other country:
AfghanistanAlbaniaAlgeriaAndorraAngolaAntigua and BarbudaArab WorldArgentinaArmeniaArubaAustraliaAustriaAzerbaijanBahamas, TheBahrainBangladeshBarbadosBelarusBelgiumBelizeBeninBermudaBhutanBoliviaBosnia and HerzegovinaBotswanaBrazilBrunei DarussalamBulgariaBurkina FasoBurundiCabo VerdeCambodiaCameroonCanadaCaribbean small statesCayman IslandsCentral African RepublicCentral Europe and the BalticsChadChannel IslandsChileChinaColombiaComorosCongo, Dem. Rep.Congo, Rep.Costa RicaCote d'IvoireCroatiaCubaCyprusCzech RepublicDenmarkDjiboutiDominicaDominican RepublicEarly-demographic dividendEast Asia & PacificEast Asia & Pacific (excluding high income)East Asia & Pacific (IDA & IBRD countries)EcuadorEgypt, Arab Rep.El SalvadorEquatorial GuineaEritreaEstoniaEthiopiaEuro areaEurope & Central AsiaEurope & Central Asia (excluding high income)Europe & Central Asia (IDA & IBRD countries)European UnionFijiFinlandFragile and conflict affected situationsFranceFrench PolynesiaGabonGambia, TheGeorgiaGermanyGhanaGreeceGreenlandGrenadaGuatemalaGuineaGuinea-BissauGuyanaHaitiHeavily indebted poor countries (HIPC)High incomeHondurasHong Kong SAR, ChinaHungaryIBRD onlyIcelandIDA & IBRD totalIDA blendIDA onlyIDA totalIndiaIndonesiaIran, Islamic Rep.IraqIrelandIsle of ManIsraelItalyJamaicaJapanJordanKazakhstanKenyaKiribatiKorea, Rep.KosovoKuwaitKyrgyz RepublicLao PDRLate-demographic dividendLatin America & Caribbean Latin America & Caribbean (excluding high income)Latin America & the Caribbean (IDA & IBRD countries)LatviaLeast developed countries: UN classificationLebanonLesothoLiberiaLibyaLiechtensteinLithuaniaLow & middle incomeLow incomeLower middle incomeLuxembourgMacao SAR, ChinaMacedonia, FYRMadagascarMalawiMalaysiaMaldivesMaliMaltaMarshall IslandsMauritaniaMauritiusMexicoMicronesia, Fed. Sts.Middle East & North AfricaMiddle East & North Africa (excluding high income)Middle East & North Africa (IDA & IBRD countries)Middle incomeMoldovaMonacoMongoliaMontenegroMoroccoMozambiqueMyanmarNamibiaNauruNepalNetherlandsNew CaledoniaNew ZealandNicaraguaNigerNigeriaNorth AmericaNorwayOECD membersOmanOther small statesPacific island small statesPakistanPalauPanamaPapua New GuineaParaguayPeruPhilippinesPolandPortugalPost-demographic dividendPre-demographic dividendPuerto RicoQatarRomaniaRussian FederationRwandaSamoaSan MarinoSao Tome and PrincipeSaudi ArabiaSenegalSerbiaSeychellesSierra LeoneSingaporeSlovak RepublicSloveniaSmall statesSolomon IslandsSomaliaSouth AfricaSouth AsiaSouth Asia (IDA & IBRD)South SudanSpainSri LankaSt. Kitts and NevisSt. LuciaSt. Vincent and the GrenadinesSub-Saharan Africa Sub-Saharan Africa (excluding high income)Sub-Saharan Africa (IDA & IBRD countries)SudanSurinameSwazilandSwedenSwitzerlandSyrian Arab RepublicTajikistanTanzaniaThailandTimor-LesteTogoTongaTrinidad and TobagoTunisiaTurkeyTurkmenistanTuvaluUgandaUkraineUnited Arab EmiratesUnited KingdomUnited StatesUpper middle incomeUruguayUzbekistanVanuatuVenezuela, RBVietnamVirgin Islands (U.S.)West Bank and GazaWorldYemen, Rep.ZambiaZimbabwe Timeline:
This timeline shows a graph from 1962 to 2016 of Italy. No data until 1961. Number of actual observations by date: 55.
Source name:
World Development Indicators
Source organization:
World Bank national accounts data, and OECD National Accounts data files.
Categories, topics:
Economy & Growth
Last updated:
apr 23, 2017
Indicators value changes by year
Minimum:
-5.912
jan 1, 2010
At the date of observation
Value
Absolute change
Change from previous value
jan 1, 1962
7.486
+7.486
0.0%
jan 1, 1963
5.487
-1.999
-26.7%
jan 1, 1964
4.842
-0.645
-11.76%
jan 1, 1965
1.956
-2.887
-59.61%
jan 1, 1966
2.402
+0.447
22.83%
jan 1, 1967
5.164
+2.762
114.99%
jan 1, 1968
6.406
+1.242
24.04%
jan 1, 1969
5.874
-0.532
-8.31%
jan 1, 1970
5.499
-0.374
-6.37%
jan 1, 1971
4.713
-0.786
-14.29%
jan 1, 1972
1.344
-3.369
-71.48%
jan 1, 1973
3.103
+1.759
130.87%
jan 1, 1974
6.402
+3.298
106.28%
jan 1, 1975
4.812
-1.59
-24.83%
jan 1, 1976
-2.673
-7.485
-155.55%
jan 1, 1977
6.592
+9.266
-346.61%
jan 1, 1978
2.126
-4.466
-67.75%
jan 1, 1979
2.873
+0.747
35.14%
jan 1, 1980
5.653
+2.78
96.78%
jan 1, 1981
3.217
-2.436
-43.09%
jan 1, 1982
0.723
-2.494
-77.52%
jan 1, 1983
0.339
-0.384
-53.1%
jan 1, 1984
1.132
+0.793
233.85%
jan 1, 1985
3.203
+2.07
182.81%
jan 1, 1986
2.768
-0.434
-13.56%
jan 1, 1987
2.854
+0.086
3.11%
jan 1, 1988
3.181
+0.327
11.46%
jan 1, 1989
4.144
+0.963
30.26%
jan 1, 1990
3.311
-0.833
-20.11%
jan 1, 1991
1.9
-1.41
-42.6%
jan 1, 1992
1.468
-0.432
-22.75%
jan 1, 1993
0.766
-0.702
-47.84%
jan 1, 1994
-0.913
-1.679
-219.27%
jan 1, 1995
2.13
+3.044
-333.22%
jan 1, 1996
2.885
+0.755
35.44%
jan 1, 1997
1.258
-1.627
-56.4%
jan 1, 1998
1.782
+0.524
41.62%
jan 1, 1999
1.587
-0.195
-10.93%
jan 1, 2000
1.543
-0.044
-2.78%
jan 1, 2001
3.663
+2.12
137.44%
jan 1, 2002
1.715
-1.948
-53.18%
jan 1, 2003
0.099
-1.616
-94.21%
jan 1, 2004
-0.293
-0.392
-394.72%
jan 1, 2005
0.927
+1.22
-416.4%
jan 1, 2006
0.455
-0.472
-50.92%
jan 1, 2007
1.7
+1.246
273.87%
jan 1, 2008
0.963
-0.738
-43.38%
jan 1, 2009
-1.704
-2.667
-276.96%
jan 1, 2010
-5.912
-4.208
246.98%
jan 1, 2011
1.374
+7.286
-123.25%
jan 1, 2012
0.404
-0.97
-70.62%
jan 1, 2013
-3.081
-3.484
-862.9%
jan 1, 2014
-2.861
+0.22
-7.14%
jan 1, 2015
-0.822
+2.039
-71.26%
jan 1, 2016
0.71
+1.533
-186.38%
Ranking of countries by current statistics by years


Comments: