29
/
en
AIzaSyAYiBZKx7MnpbEhh9jyipgxe19OcubqV5w
April 1, 2024
150374
Honduras
HND
true
2
1
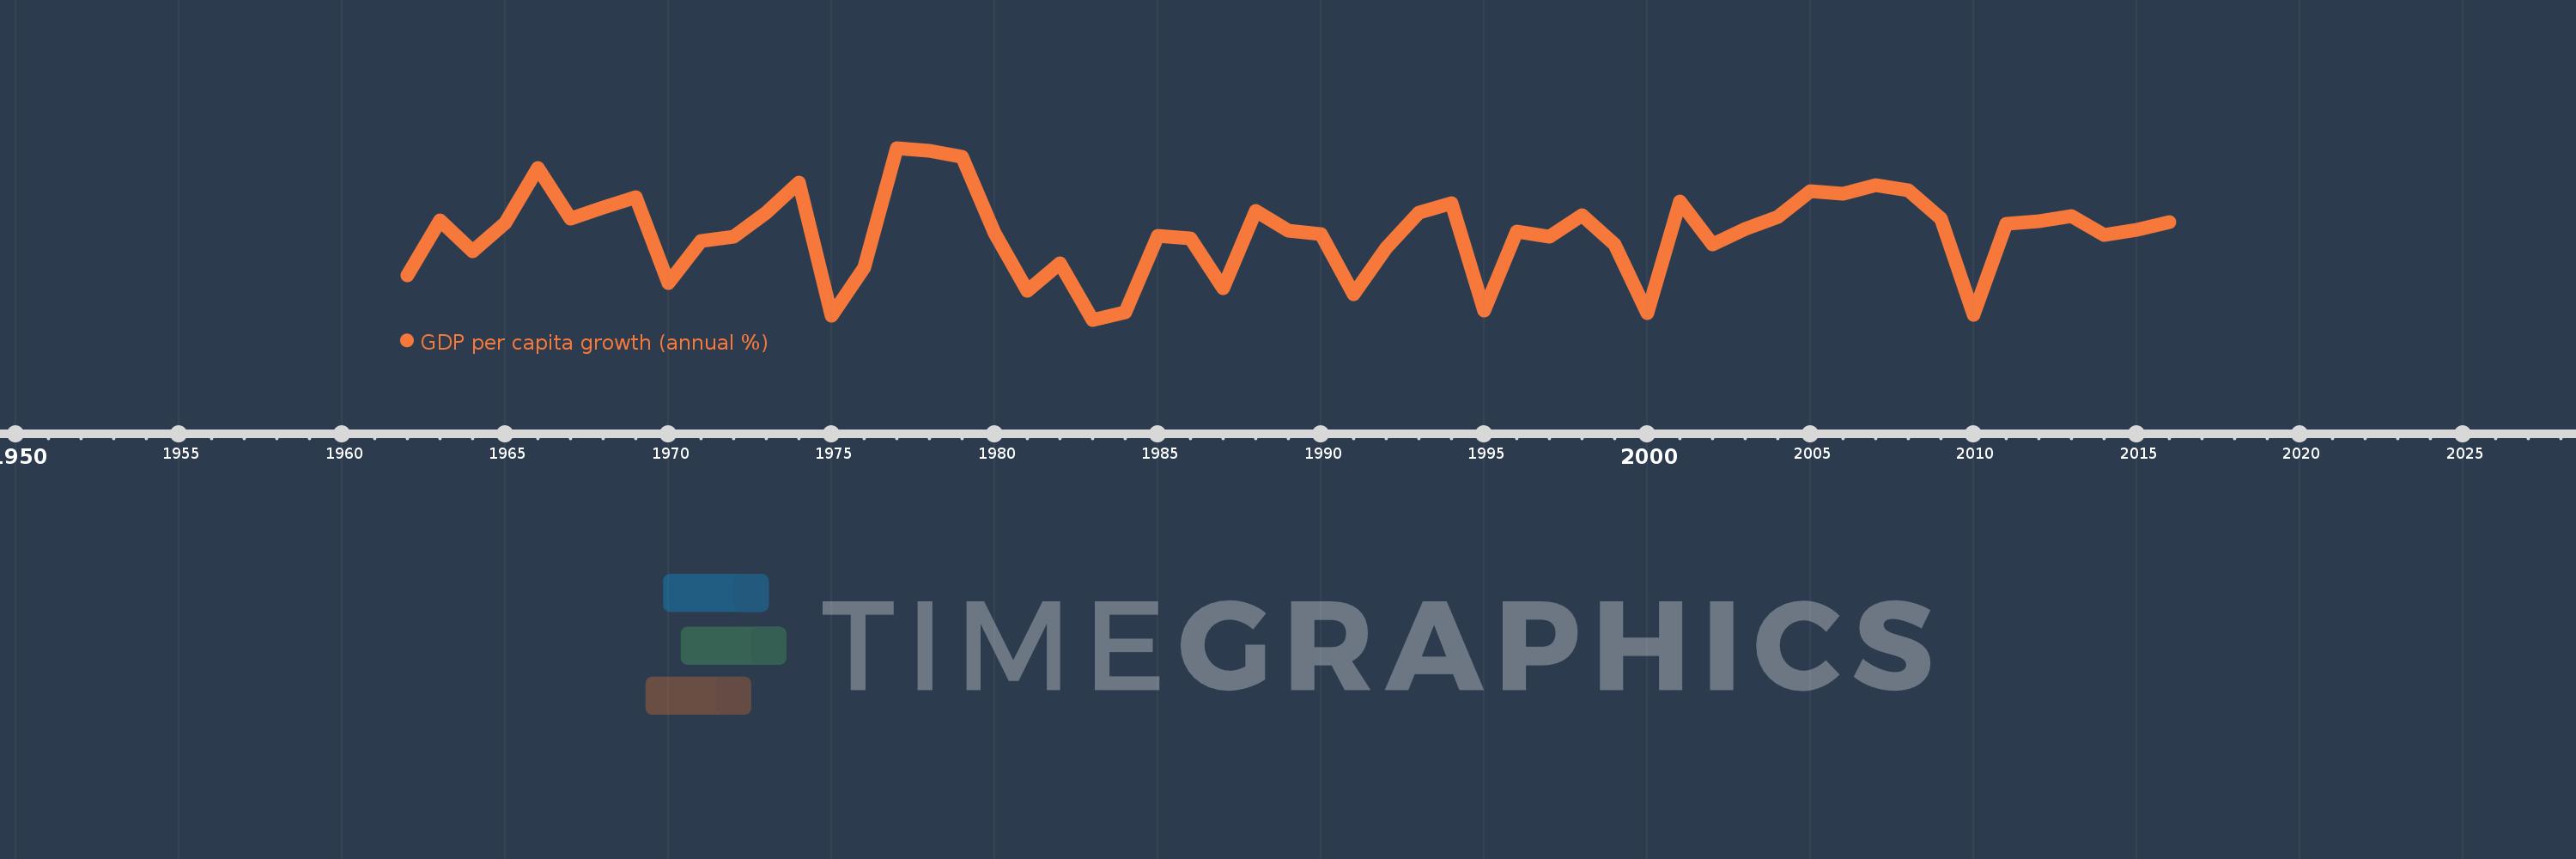
GDP per capita growth (annual %)
2016,2015,2014,2013,2012,2011,2010,2009,2008,2007,2006,2005,2004,2003,2002,2001,2000,1999,1998,1997,1996,1995,1994,1993,1992,1991,1990,1989,1988,1987,1986,1985,1984,1983,1982,1981,1980,1979,1978,1977,1976,1975,1974,1973,1972,1971,1970,1969,1968,1967,1966,1965,1964,1963,1962
This statistics in other country:
AfghanistanAlbaniaAlgeriaAndorraAngolaAntigua and BarbudaArab WorldArgentinaArmeniaArubaAustraliaAustriaAzerbaijanBahamas, TheBahrainBangladeshBarbadosBelarusBelgiumBelizeBeninBermudaBhutanBoliviaBosnia and HerzegovinaBotswanaBrazilBrunei DarussalamBulgariaBurkina FasoBurundiCabo VerdeCambodiaCameroonCanadaCaribbean small statesCayman IslandsCentral African RepublicCentral Europe and the BalticsChadChannel IslandsChileChinaColombiaComorosCongo, Dem. Rep.Congo, Rep.Costa RicaCote d'IvoireCroatiaCubaCyprusCzech RepublicDenmarkDjiboutiDominicaDominican RepublicEarly-demographic dividendEast Asia & PacificEast Asia & Pacific (excluding high income)East Asia & Pacific (IDA & IBRD countries)EcuadorEgypt, Arab Rep.El SalvadorEquatorial GuineaEritreaEstoniaEthiopiaEuro areaEurope & Central AsiaEurope & Central Asia (excluding high income)Europe & Central Asia (IDA & IBRD countries)European UnionFijiFinlandFragile and conflict affected situationsFranceFrench PolynesiaGabonGambia, TheGeorgiaGermanyGhanaGreeceGreenlandGrenadaGuatemalaGuineaGuinea-BissauGuyanaHaitiHeavily indebted poor countries (HIPC)High incomeHondurasHong Kong SAR, ChinaHungaryIBRD onlyIcelandIDA & IBRD totalIDA blendIDA onlyIDA totalIndiaIndonesiaIran, Islamic Rep.IraqIrelandIsle of ManIsraelItalyJamaicaJapanJordanKazakhstanKenyaKiribatiKorea, Rep.KosovoKuwaitKyrgyz RepublicLao PDRLate-demographic dividendLatin America & Caribbean Latin America & Caribbean (excluding high income)Latin America & the Caribbean (IDA & IBRD countries)LatviaLeast developed countries: UN classificationLebanonLesothoLiberiaLibyaLiechtensteinLithuaniaLow & middle incomeLow incomeLower middle incomeLuxembourgMacao SAR, ChinaMacedonia, FYRMadagascarMalawiMalaysiaMaldivesMaliMaltaMarshall IslandsMauritaniaMauritiusMexicoMicronesia, Fed. Sts.Middle East & North AfricaMiddle East & North Africa (excluding high income)Middle East & North Africa (IDA & IBRD countries)Middle incomeMoldovaMonacoMongoliaMontenegroMoroccoMozambiqueMyanmarNamibiaNauruNepalNetherlandsNew CaledoniaNew ZealandNicaraguaNigerNigeriaNorth AmericaNorwayOECD membersOmanOther small statesPacific island small statesPakistanPalauPanamaPapua New GuineaParaguayPeruPhilippinesPolandPortugalPost-demographic dividendPre-demographic dividendPuerto RicoQatarRomaniaRussian FederationRwandaSamoaSan MarinoSao Tome and PrincipeSaudi ArabiaSenegalSerbiaSeychellesSierra LeoneSingaporeSlovak RepublicSloveniaSmall statesSolomon IslandsSomaliaSouth AfricaSouth AsiaSouth Asia (IDA & IBRD)South SudanSpainSri LankaSt. Kitts and NevisSt. LuciaSt. Vincent and the GrenadinesSub-Saharan Africa Sub-Saharan Africa (excluding high income)Sub-Saharan Africa (IDA & IBRD countries)SudanSurinameSwazilandSwedenSwitzerlandSyrian Arab RepublicTajikistanTanzaniaThailandTimor-LesteTogoTongaTrinidad and TobagoTunisiaTurkeyTurkmenistanTuvaluUgandaUkraineUnited Arab EmiratesUnited KingdomUnited StatesUpper middle incomeUruguayUzbekistanVanuatuVenezuela, RBVietnamVirgin Islands (U.S.)West Bank and GazaWorldYemen, Rep.ZambiaZimbabwe Timeline:
This timeline shows a graph from 1962 to 2016 of Honduras. No data until 1961. Number of actual observations by date: 55.
Source name:
World Development Indicators
Source organization:
World Bank national accounts data, and OECD National Accounts data files.
Categories, topics:
Economy & Growth
Last updated:
apr 23, 2017
Indicators value changes by year
Minimum:
-4.385
jan 1, 1983
At the date of observation
Value
Absolute change
Change from previous value
jan 1, 1962
-1.43
-1.43
0.0%
jan 1, 1963
2.298
+3.728
-260.65%
jan 1, 1964
0.211
-2.087
-90.83%
jan 1, 1965
2.109
+1.899
901.49%
jan 1, 1966
5.799
+3.689
174.92%
jan 1, 1967
2.431
-3.368
-58.08%
jan 1, 1968
3.162
+0.731
30.08%
jan 1, 1969
3.845
+0.683
21.61%
jan 1, 1970
-1.95
-5.795
-150.71%
jan 1, 1971
0.882
+2.831
-145.21%
jan 1, 1972
1.171
+0.289
32.78%
jan 1, 1973
2.833
+1.662
141.99%
jan 1, 1974
4.815
+1.982
69.98%
jan 1, 1975
-4.091
-8.906
-184.96%
jan 1, 1976
-0.897
+3.194
-78.07%
jan 1, 1977
7.151
+8.048
-897.24%
jan 1, 1978
6.976
-0.175
-2.45%
jan 1, 1979
6.575
-0.4
-5.74%
jan 1, 1980
1.401
-5.175
-78.69%
jan 1, 1981
-2.449
-3.85
-274.78%
jan 1, 1982
-0.61
+1.839
-75.09%
jan 1, 1983
-4.385
-3.775
618.99%
jan 1, 1984
-3.907
+0.478
-10.9%
jan 1, 1985
1.224
+5.131
-131.33%
jan 1, 1986
1.089
-0.135
-11.07%
jan 1, 1987
-2.252
-3.341
-306.9%
jan 1, 1988
2.932
+5.184
-230.18%
jan 1, 1989
1.592
-1.34
-45.71%
jan 1, 1990
1.364
-0.227
-14.29%
jan 1, 1991
-2.691
-4.055
-297.21%
jan 1, 1992
0.432
+3.123
-116.05%
jan 1, 1993
2.8
+2.368
548.26%
jan 1, 1994
3.464
+0.664
23.71%
jan 1, 1995
-3.79
-7.253
-209.41%
jan 1, 1996
1.538
+5.328
-140.59%
jan 1, 1997
1.18
-0.358
-23.27%
jan 1, 1998
2.639
+1.458
123.56%
jan 1, 1999
0.671
-1.967
-74.55%
jan 1, 2000
-3.957
-4.629
-689.41%
jan 1, 2001
3.571
+7.528
-190.24%
jan 1, 2002
0.656
-2.915
-81.63%
jan 1, 2003
1.716
+1.06
161.59%
jan 1, 2004
2.539
+0.823
47.96%
jan 1, 2005
4.234
+1.695
66.78%
jan 1, 2006
4.096
-0.138
-3.26%
jan 1, 2007
4.638
+0.542
13.24%
jan 1, 2008
4.302
-0.336
-7.24%
jan 1, 2009
2.426
-1.876
-43.6%
jan 1, 2010
-4.065
-6.492
-267.55%
jan 1, 2011
2.062
+6.127
-150.71%
jan 1, 2012
2.234
+0.173
8.38%
jan 1, 2013
2.585
+0.35
15.68%
jan 1, 2014
1.313
-1.272
-49.21%
jan 1, 2015
1.627
+0.314
23.95%
jan 1, 2016
2.188
+0.561
34.46%
Ranking of countries by current statistics by years


Comments: