29
/
en
AIzaSyAYiBZKx7MnpbEhh9jyipgxe19OcubqV5w
April 1, 2024
94867
Burkina Faso
BFA
true
2
1
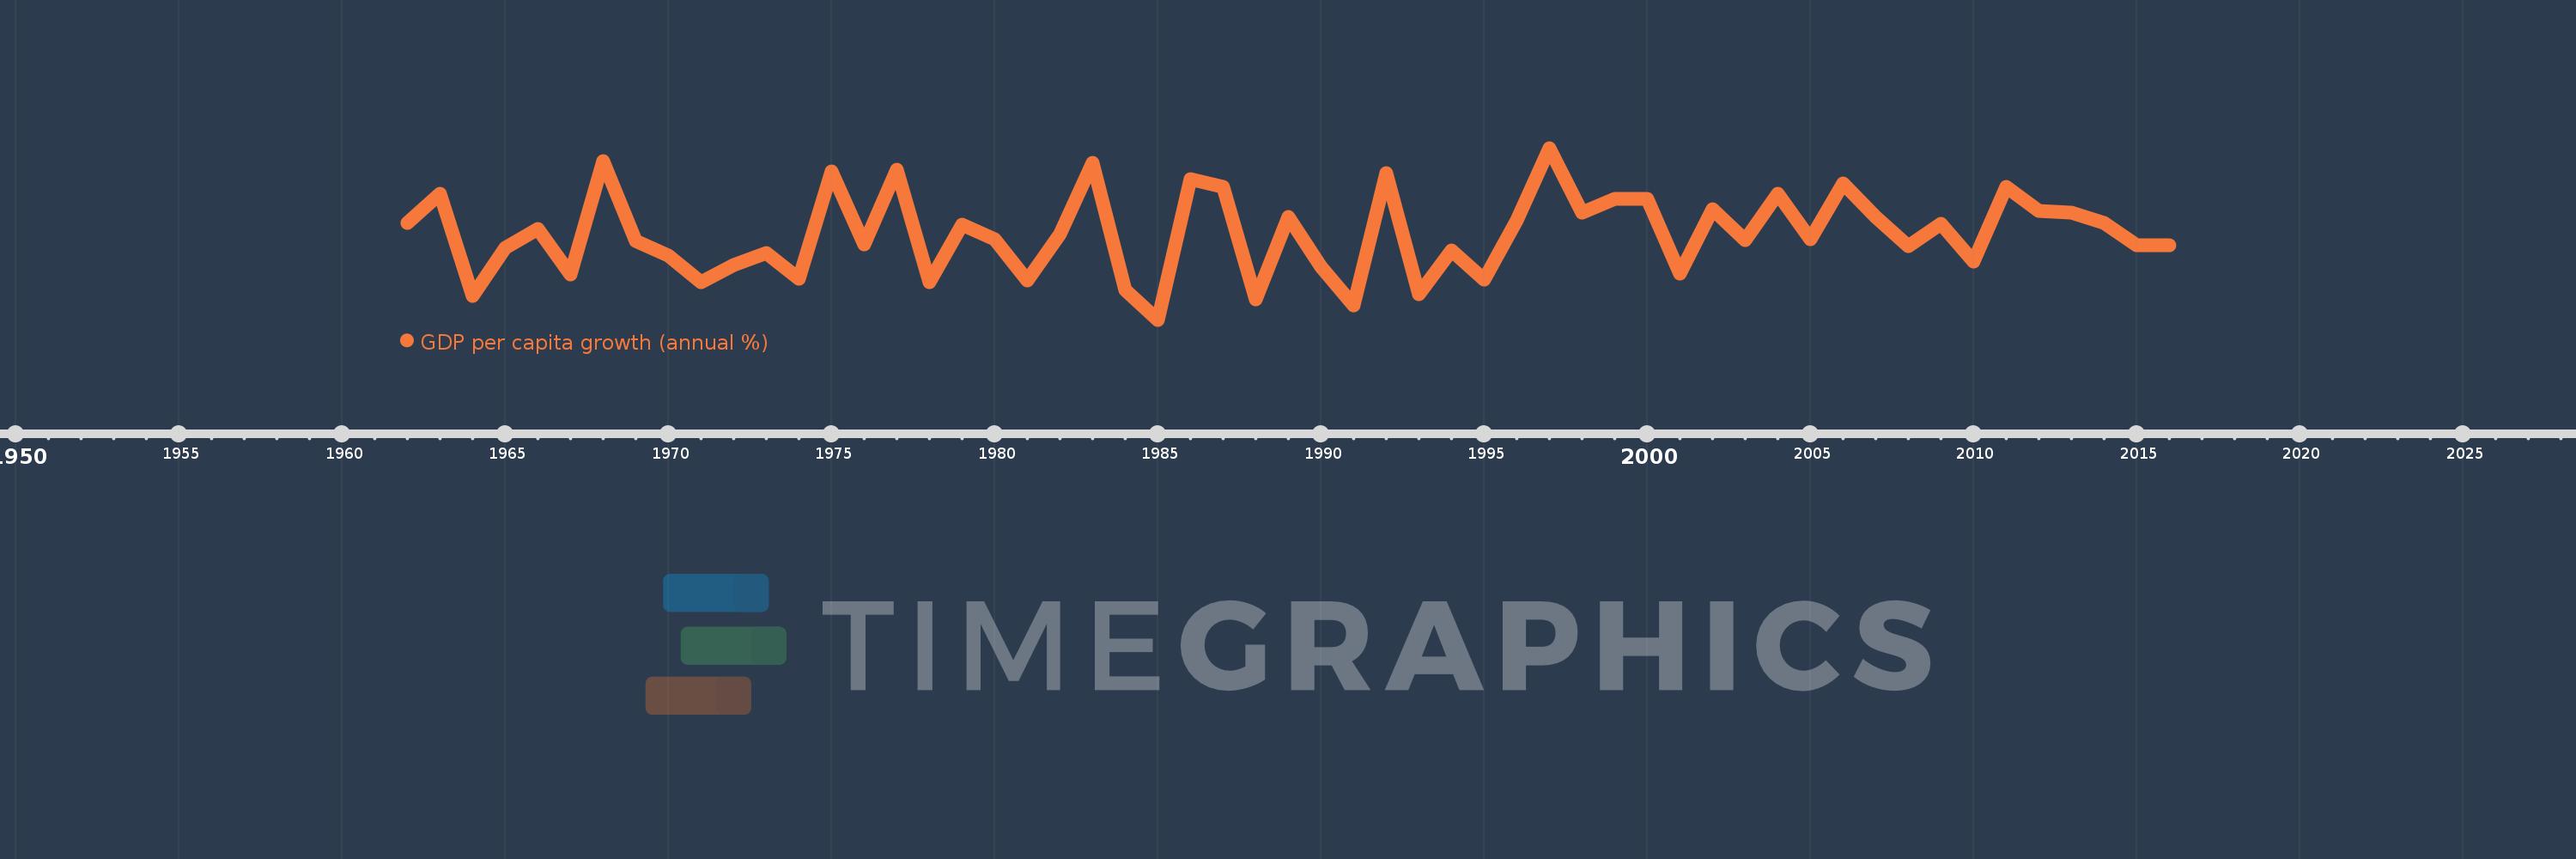
GDP per capita growth (annual %)
2016,2015,2014,2013,2012,2011,2010,2009,2008,2007,2006,2005,2004,2003,2002,2001,2000,1999,1998,1997,1996,1995,1994,1993,1992,1991,1990,1989,1988,1987,1986,1985,1984,1983,1982,1981,1980,1979,1978,1977,1976,1975,1974,1973,1972,1971,1970,1969,1968,1967,1966,1965,1964,1963,1962
This statistics in other country:
AfghanistanAlbaniaAlgeriaAndorraAngolaAntigua and BarbudaArab WorldArgentinaArmeniaArubaAustraliaAustriaAzerbaijanBahamas, TheBahrainBangladeshBarbadosBelarusBelgiumBelizeBeninBermudaBhutanBoliviaBosnia and HerzegovinaBotswanaBrazilBrunei DarussalamBulgariaBurkina FasoBurundiCabo VerdeCambodiaCameroonCanadaCaribbean small statesCayman IslandsCentral African RepublicCentral Europe and the BalticsChadChannel IslandsChileChinaColombiaComorosCongo, Dem. Rep.Congo, Rep.Costa RicaCote d'IvoireCroatiaCubaCyprusCzech RepublicDenmarkDjiboutiDominicaDominican RepublicEarly-demographic dividendEast Asia & PacificEast Asia & Pacific (excluding high income)East Asia & Pacific (IDA & IBRD countries)EcuadorEgypt, Arab Rep.El SalvadorEquatorial GuineaEritreaEstoniaEthiopiaEuro areaEurope & Central AsiaEurope & Central Asia (excluding high income)Europe & Central Asia (IDA & IBRD countries)European UnionFijiFinlandFragile and conflict affected situationsFranceFrench PolynesiaGabonGambia, TheGeorgiaGermanyGhanaGreeceGreenlandGrenadaGuatemalaGuineaGuinea-BissauGuyanaHaitiHeavily indebted poor countries (HIPC)High incomeHondurasHong Kong SAR, ChinaHungaryIBRD onlyIcelandIDA & IBRD totalIDA blendIDA onlyIDA totalIndiaIndonesiaIran, Islamic Rep.IraqIrelandIsle of ManIsraelItalyJamaicaJapanJordanKazakhstanKenyaKiribatiKorea, Rep.KosovoKuwaitKyrgyz RepublicLao PDRLate-demographic dividendLatin America & Caribbean Latin America & Caribbean (excluding high income)Latin America & the Caribbean (IDA & IBRD countries)LatviaLeast developed countries: UN classificationLebanonLesothoLiberiaLibyaLiechtensteinLithuaniaLow & middle incomeLow incomeLower middle incomeLuxembourgMacao SAR, ChinaMacedonia, FYRMadagascarMalawiMalaysiaMaldivesMaliMaltaMarshall IslandsMauritaniaMauritiusMexicoMicronesia, Fed. Sts.Middle East & North AfricaMiddle East & North Africa (excluding high income)Middle East & North Africa (IDA & IBRD countries)Middle incomeMoldovaMonacoMongoliaMontenegroMoroccoMozambiqueMyanmarNamibiaNauruNepalNetherlandsNew CaledoniaNew ZealandNicaraguaNigerNigeriaNorth AmericaNorwayOECD membersOmanOther small statesPacific island small statesPakistanPalauPanamaPapua New GuineaParaguayPeruPhilippinesPolandPortugalPost-demographic dividendPre-demographic dividendPuerto RicoQatarRomaniaRussian FederationRwandaSamoaSan MarinoSao Tome and PrincipeSaudi ArabiaSenegalSerbiaSeychellesSierra LeoneSingaporeSlovak RepublicSloveniaSmall statesSolomon IslandsSomaliaSouth AfricaSouth AsiaSouth Asia (IDA & IBRD)South SudanSpainSri LankaSt. Kitts and NevisSt. LuciaSt. Vincent and the GrenadinesSub-Saharan Africa Sub-Saharan Africa (excluding high income)Sub-Saharan Africa (IDA & IBRD countries)SudanSurinameSwazilandSwedenSwitzerlandSyrian Arab RepublicTajikistanTanzaniaThailandTimor-LesteTogoTongaTrinidad and TobagoTunisiaTurkeyTurkmenistanTuvaluUgandaUkraineUnited Arab EmiratesUnited KingdomUnited StatesUpper middle incomeUruguayUzbekistanVanuatuVenezuela, RBVietnamVirgin Islands (U.S.)West Bank and GazaWorldYemen, Rep.ZambiaZimbabwe Timeline:
This timeline shows a graph from 1962 to 2016 of Burkina Faso. No data until 1961. Number of actual observations by date: 55.
Source name:
World Development Indicators
Source organization:
World Bank national accounts data, and OECD National Accounts data files.
Categories, topics:
Economy & Growth
Last updated:
apr 23, 2017
Indicators value changes by year
Minimum:
-4.261
jan 1, 1985
At the date of observation
Value
Absolute change
Change from previous value
jan 1, 1962
2.656
+2.656
0.0%
jan 1, 1963
4.722
+2.066
77.78%
jan 1, 1964
-2.593
-7.315
-154.92%
jan 1, 1965
0.857
+3.45
-133.05%
jan 1, 1966
2.241
+1.384
161.48%
jan 1, 1967
-1.021
-3.262
-145.56%
jan 1, 1968
7.058
+8.079
-791.24%
jan 1, 1969
1.344
-5.714
-80.95%
jan 1, 1970
0.289
-1.056
-78.52%
jan 1, 1971
-1.599
-1.888
-653.76%
jan 1, 1972
-0.337
+1.262
-78.93%
jan 1, 1973
0.524
+0.861
-255.39%
jan 1, 1974
-1.334
-1.858
-354.84%
jan 1, 1975
6.322
+7.657
-573.76%
jan 1, 1976
1.082
-5.24
-82.88%
jan 1, 1977
6.468
+5.386
497.7%
jan 1, 1978
-1.589
-8.057
-124.56%
jan 1, 1979
2.495
+4.084
-257.06%
jan 1, 1980
1.476
-1.019
-40.84%
jan 1, 1981
-1.437
-2.913
-197.31%
jan 1, 1982
1.833
+3.269
-227.57%
jan 1, 1983
6.913
+5.08
277.2%
jan 1, 1984
-2.151
-9.064
-131.11%
jan 1, 1985
-4.261
-2.11
98.12%
jan 1, 1986
5.756
+10.017
-235.08%
jan 1, 1987
5.195
-0.561
-9.74%
jan 1, 1988
-2.803
-7.998
-153.95%
jan 1, 1989
3.058
+5.861
-209.12%
jan 1, 1990
-0.511
-3.569
-116.71%
jan 1, 1991
-3.211
-2.7
528.51%
jan 1, 1992
6.189
+9.4
-292.73%
jan 1, 1993
-2.43
-8.619
-139.27%
jan 1, 1994
0.696
+3.126
-128.62%
jan 1, 1995
-1.411
-2.107
-302.81%
jan 1, 1996
2.853
+4.264
-302.22%
jan 1, 1997
7.987
+5.134
179.94%
jan 1, 1998
3.396
-4.59
-57.47%
jan 1, 1999
4.34
+0.944
27.79%
jan 1, 2000
4.346
+0.005
0.13%
jan 1, 2001
-0.964
-5.31
-122.17%
jan 1, 2002
3.616
+4.58
-475.26%
jan 1, 2003
1.405
-2.211
-61.15%
jan 1, 2004
4.73
+3.325
236.68%
jan 1, 2005
1.46
-3.27
-69.14%
jan 1, 2006
5.473
+4.013
274.97%
jan 1, 2007
3.087
-2.386
-43.6%
jan 1, 2008
0.974
-2.112
-68.44%
jan 1, 2009
2.599
+1.625
166.78%
jan 1, 2010
-0.14
-2.739
-105.37%
jan 1, 2011
5.212
+5.352
-3.83K%
jan 1, 2012
3.484
-1.728
-33.16%
jan 1, 2013
3.347
-0.136
-3.92%
jan 1, 2014
2.654
-0.694
-20.72%
jan 1, 2015
1.046
-1.608
-60.6%
jan 1, 2016
1.054
+0.009
0.83%
Ranking of countries by current statistics by years


Comments: